
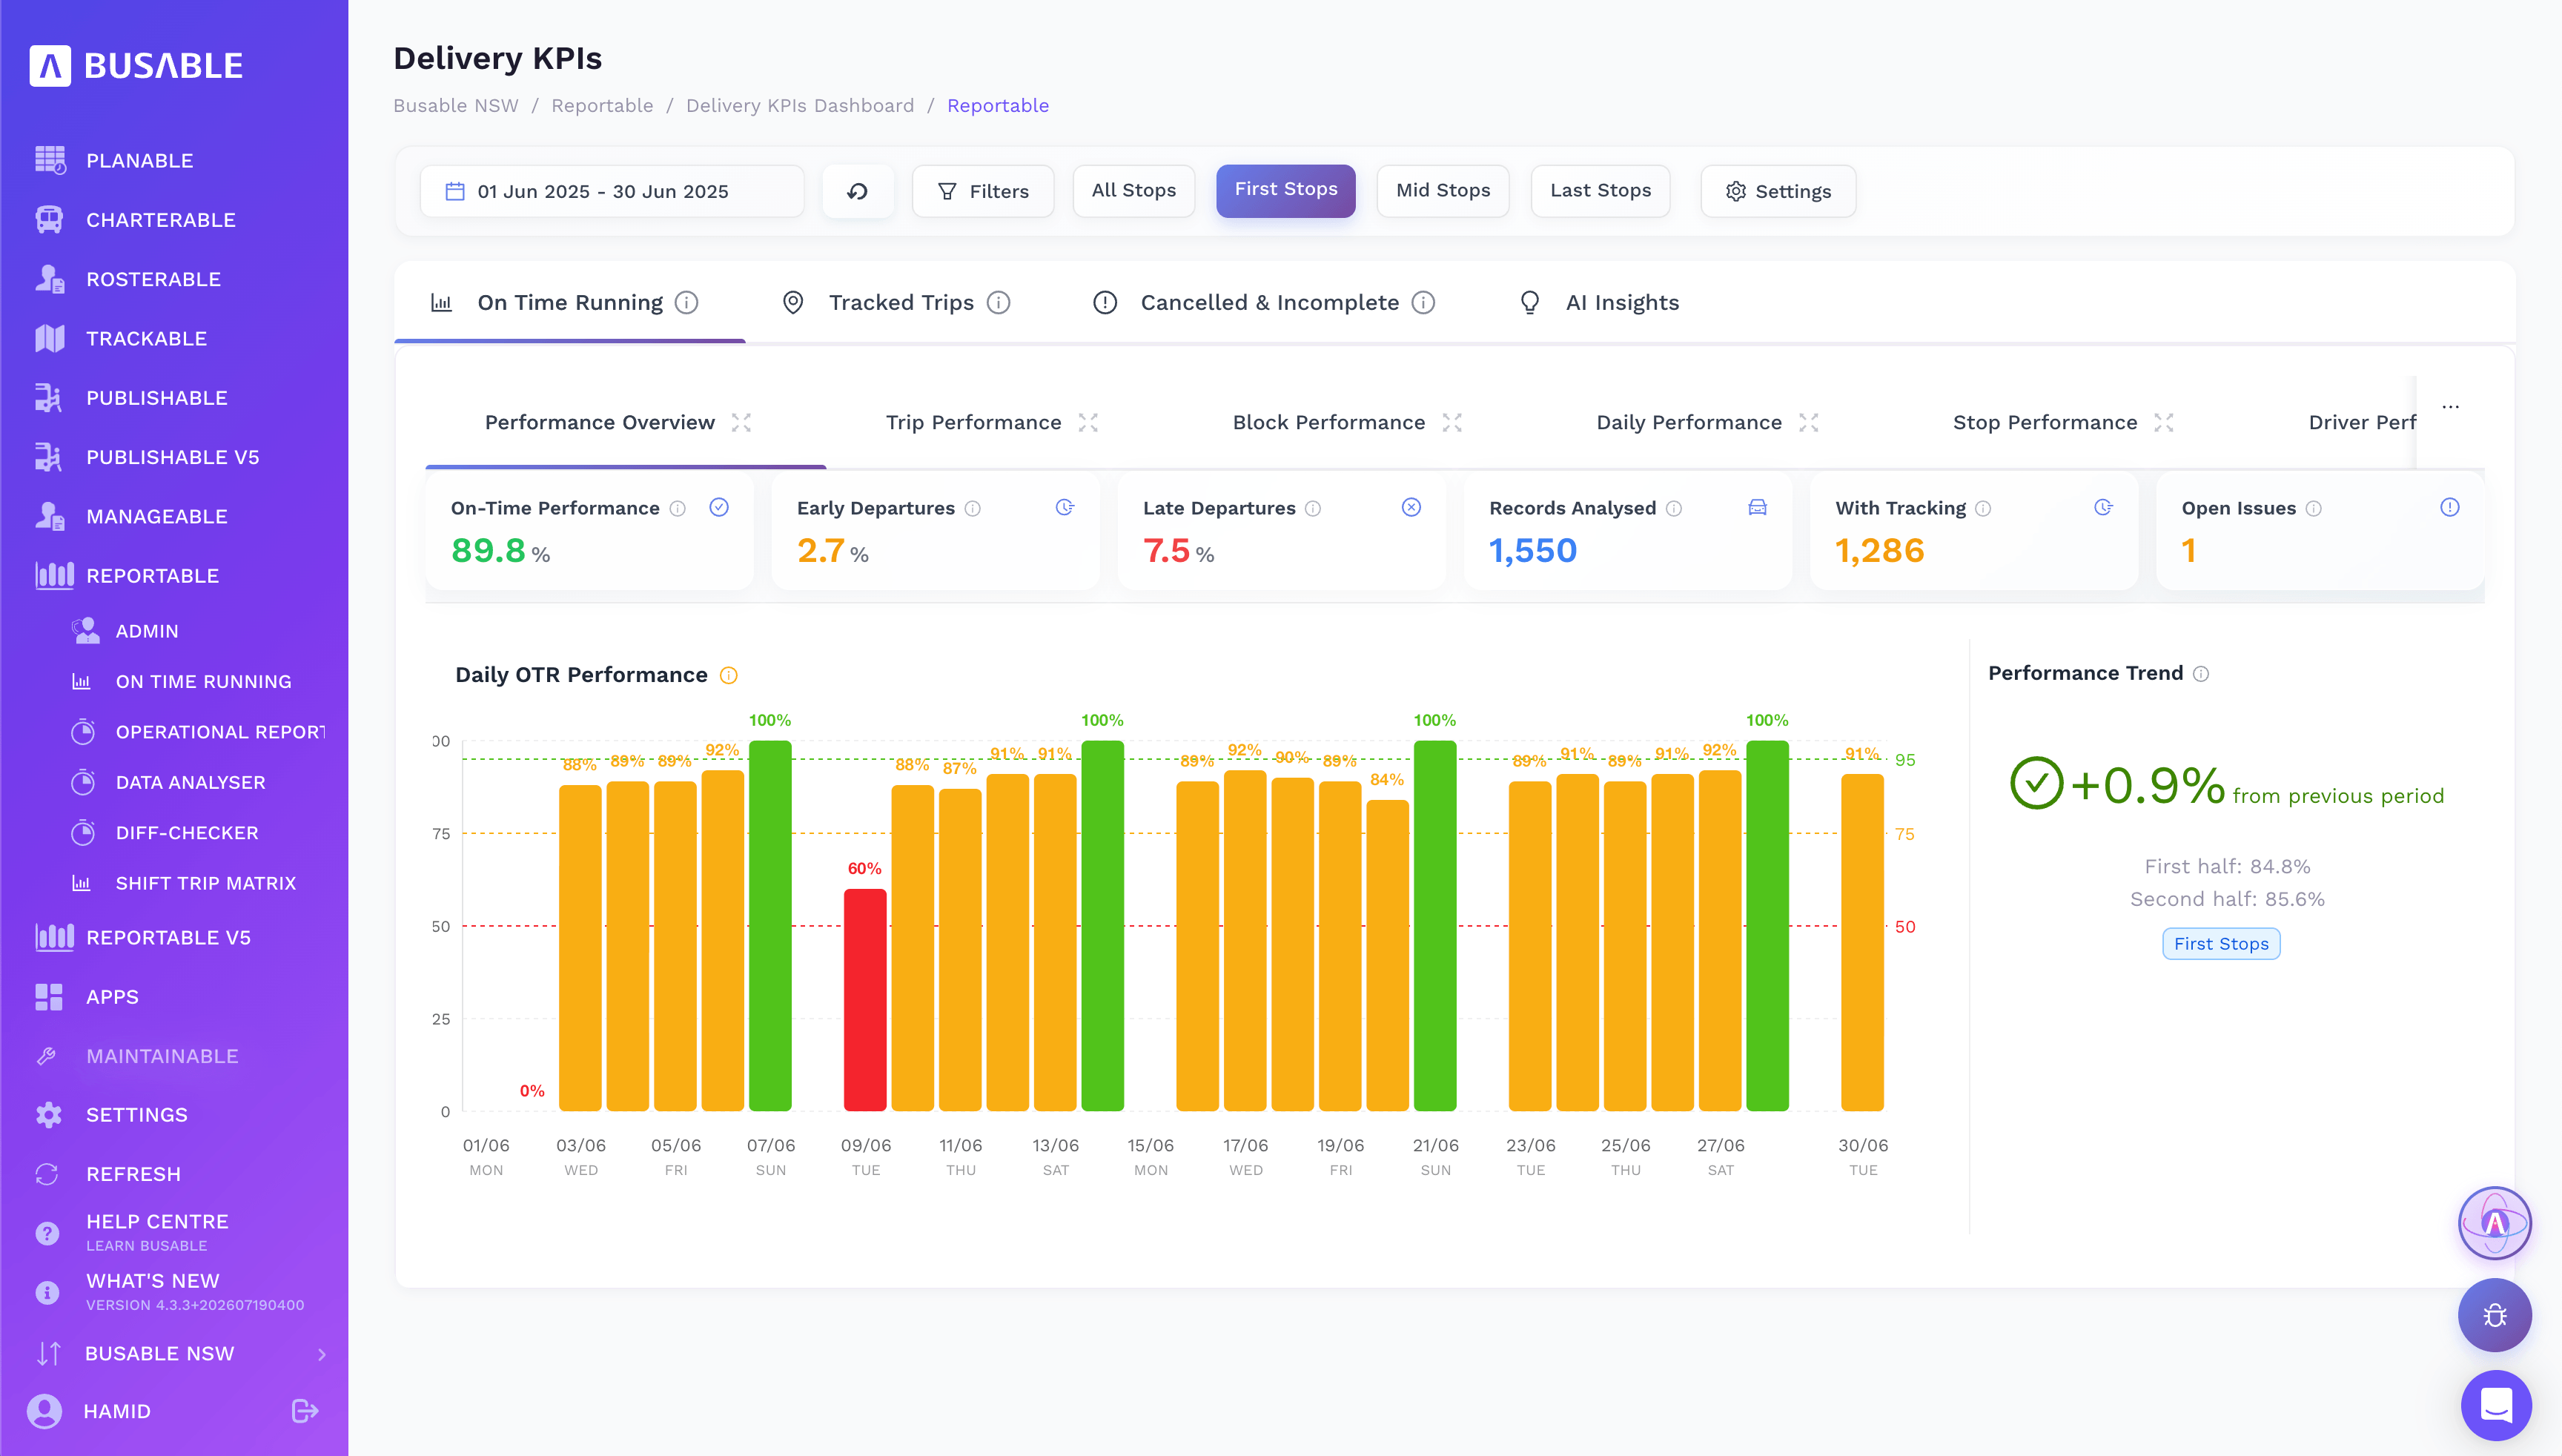
The headline OTR
On-time performance, early and late departures, records analysed and open issues, with the daily trend beside them.
On-time running, tracking coverage and cancelled or incomplete trips across the network — with AbleAI pointing to the exact trips to fix, and the tools to keep your timetable data clean.
On-time running · tracking coverage · cancelled & incomplete · AI insights · data checks · the trip matrix
On-time performance for the period, then drill in by trip, block, day, stop and driver — early and late departures, records analysed and open issues, all in one dashboard.
On-time performance, early and late departures, records analysed and open issues, with the daily trend beside them.
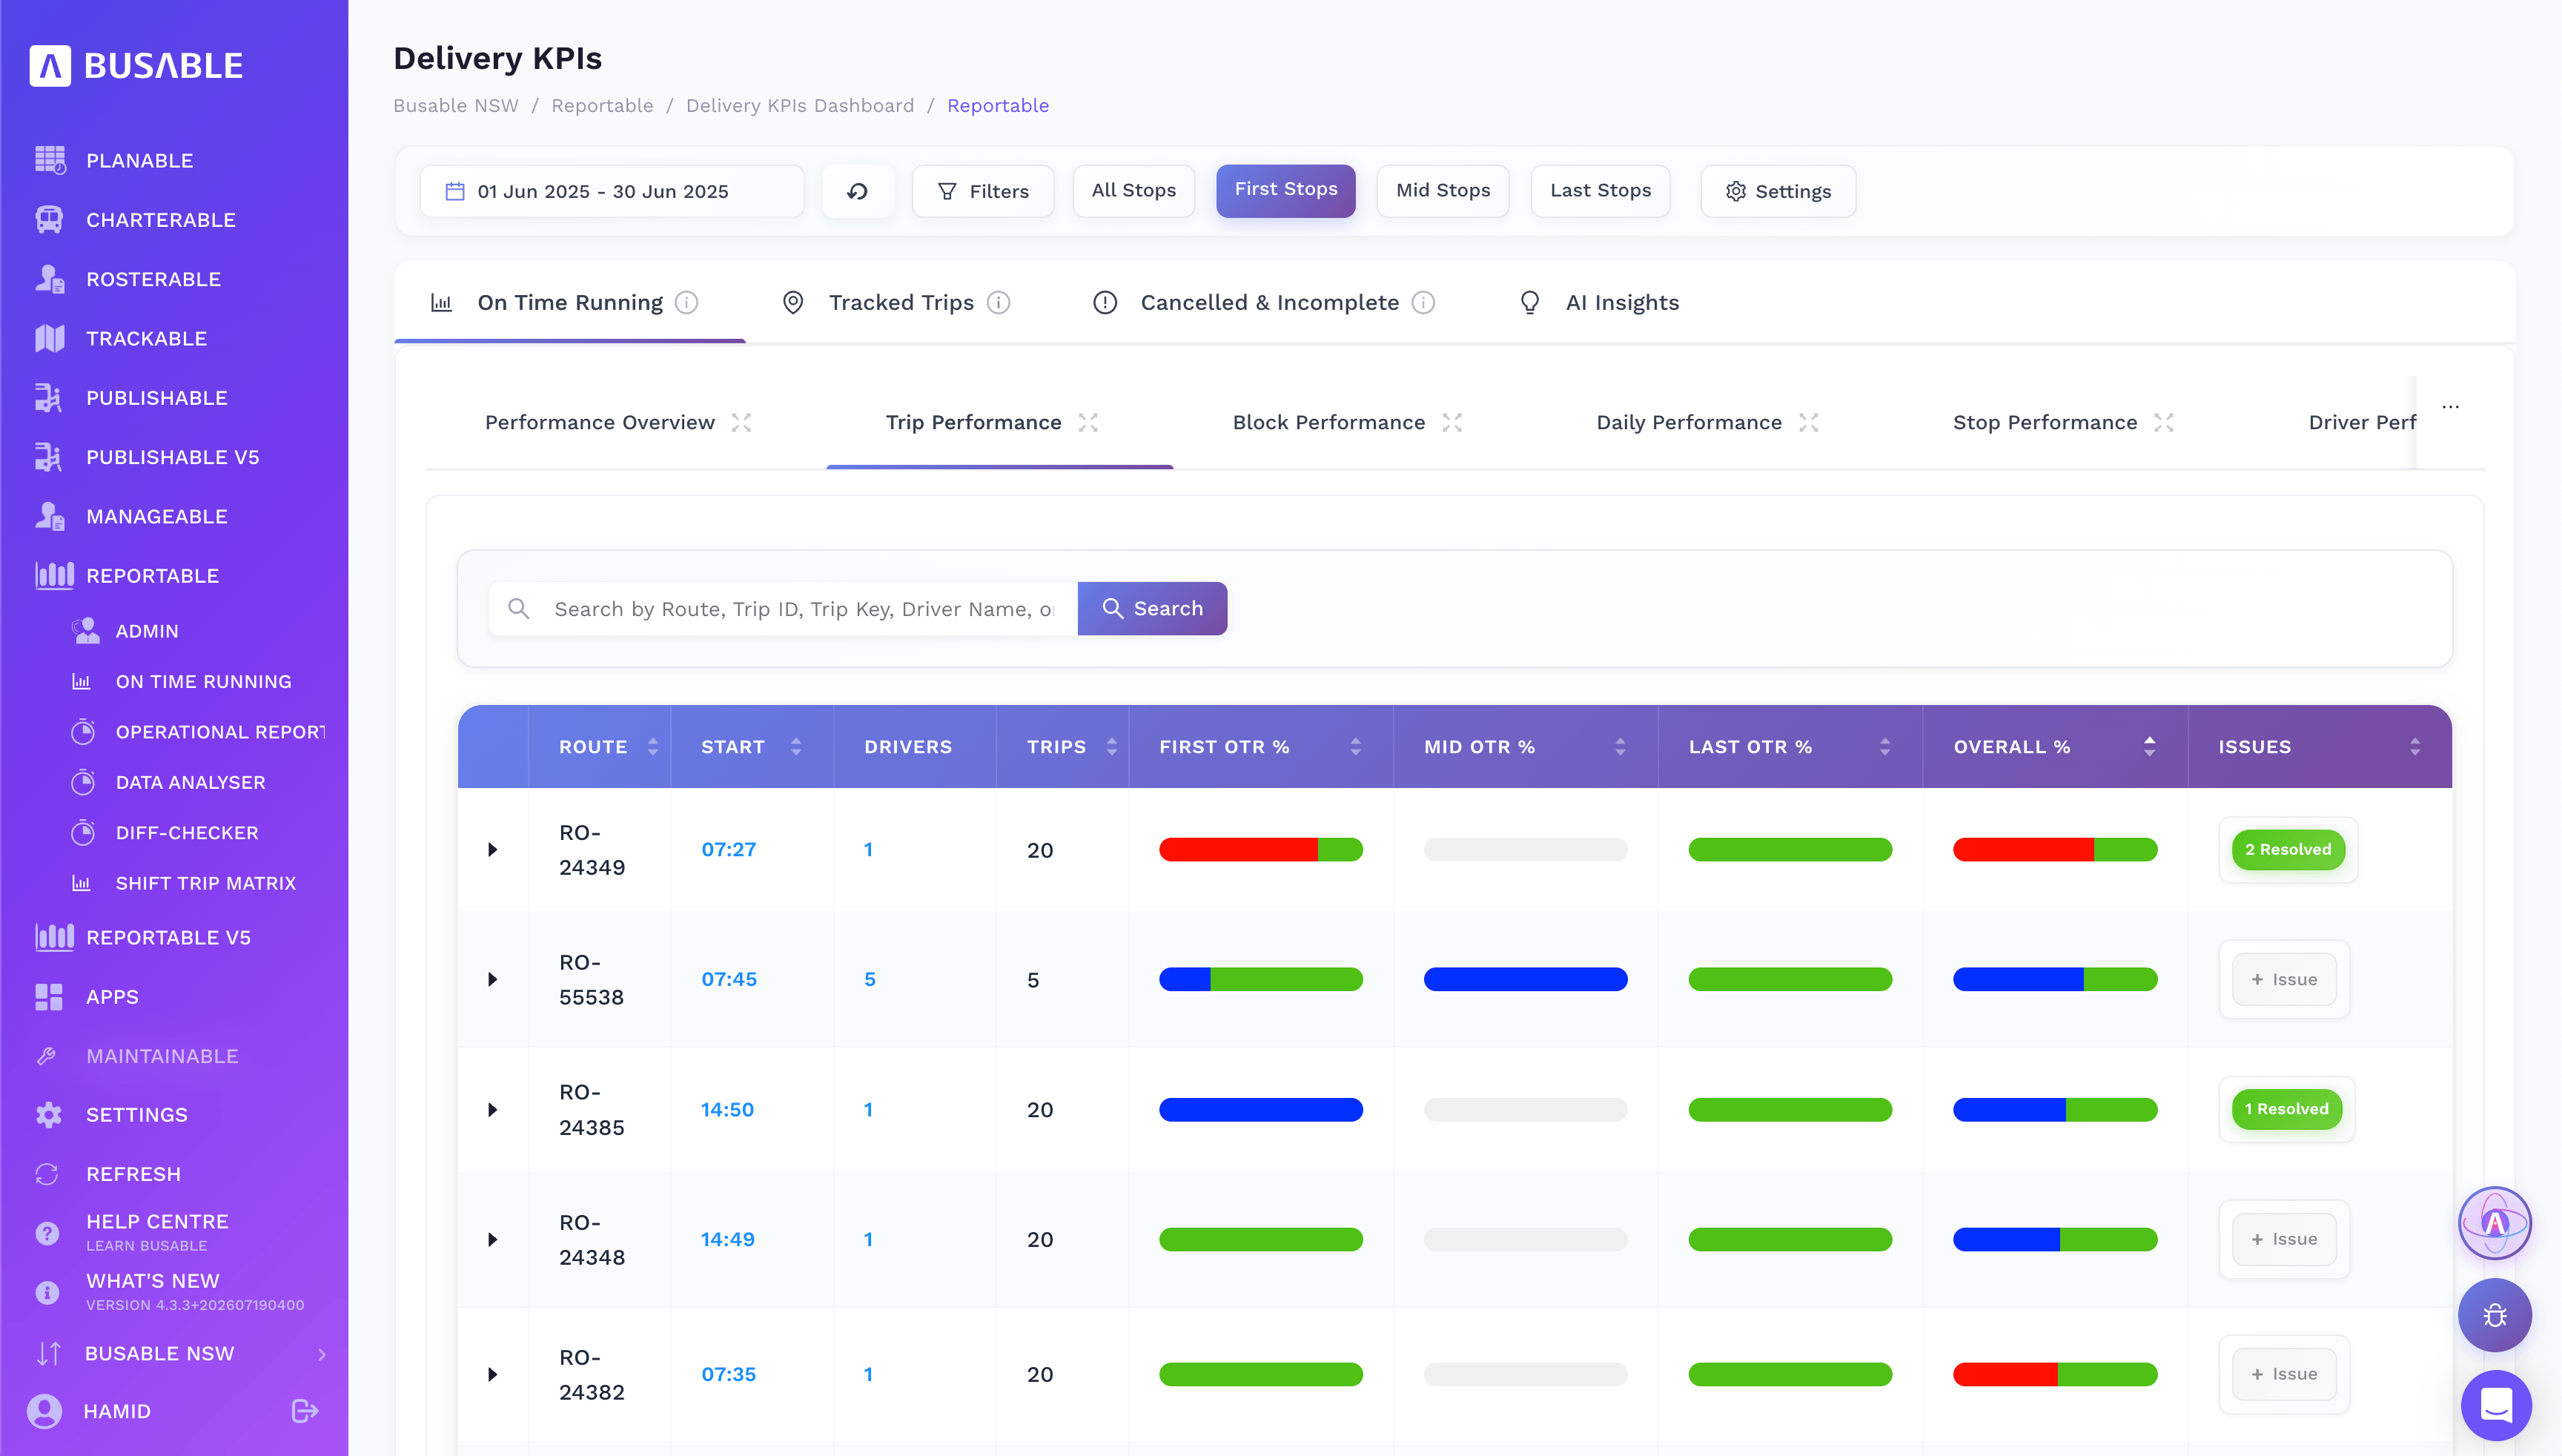
First, mid, last and overall OTR for every route, with issues raised and resolved against each.
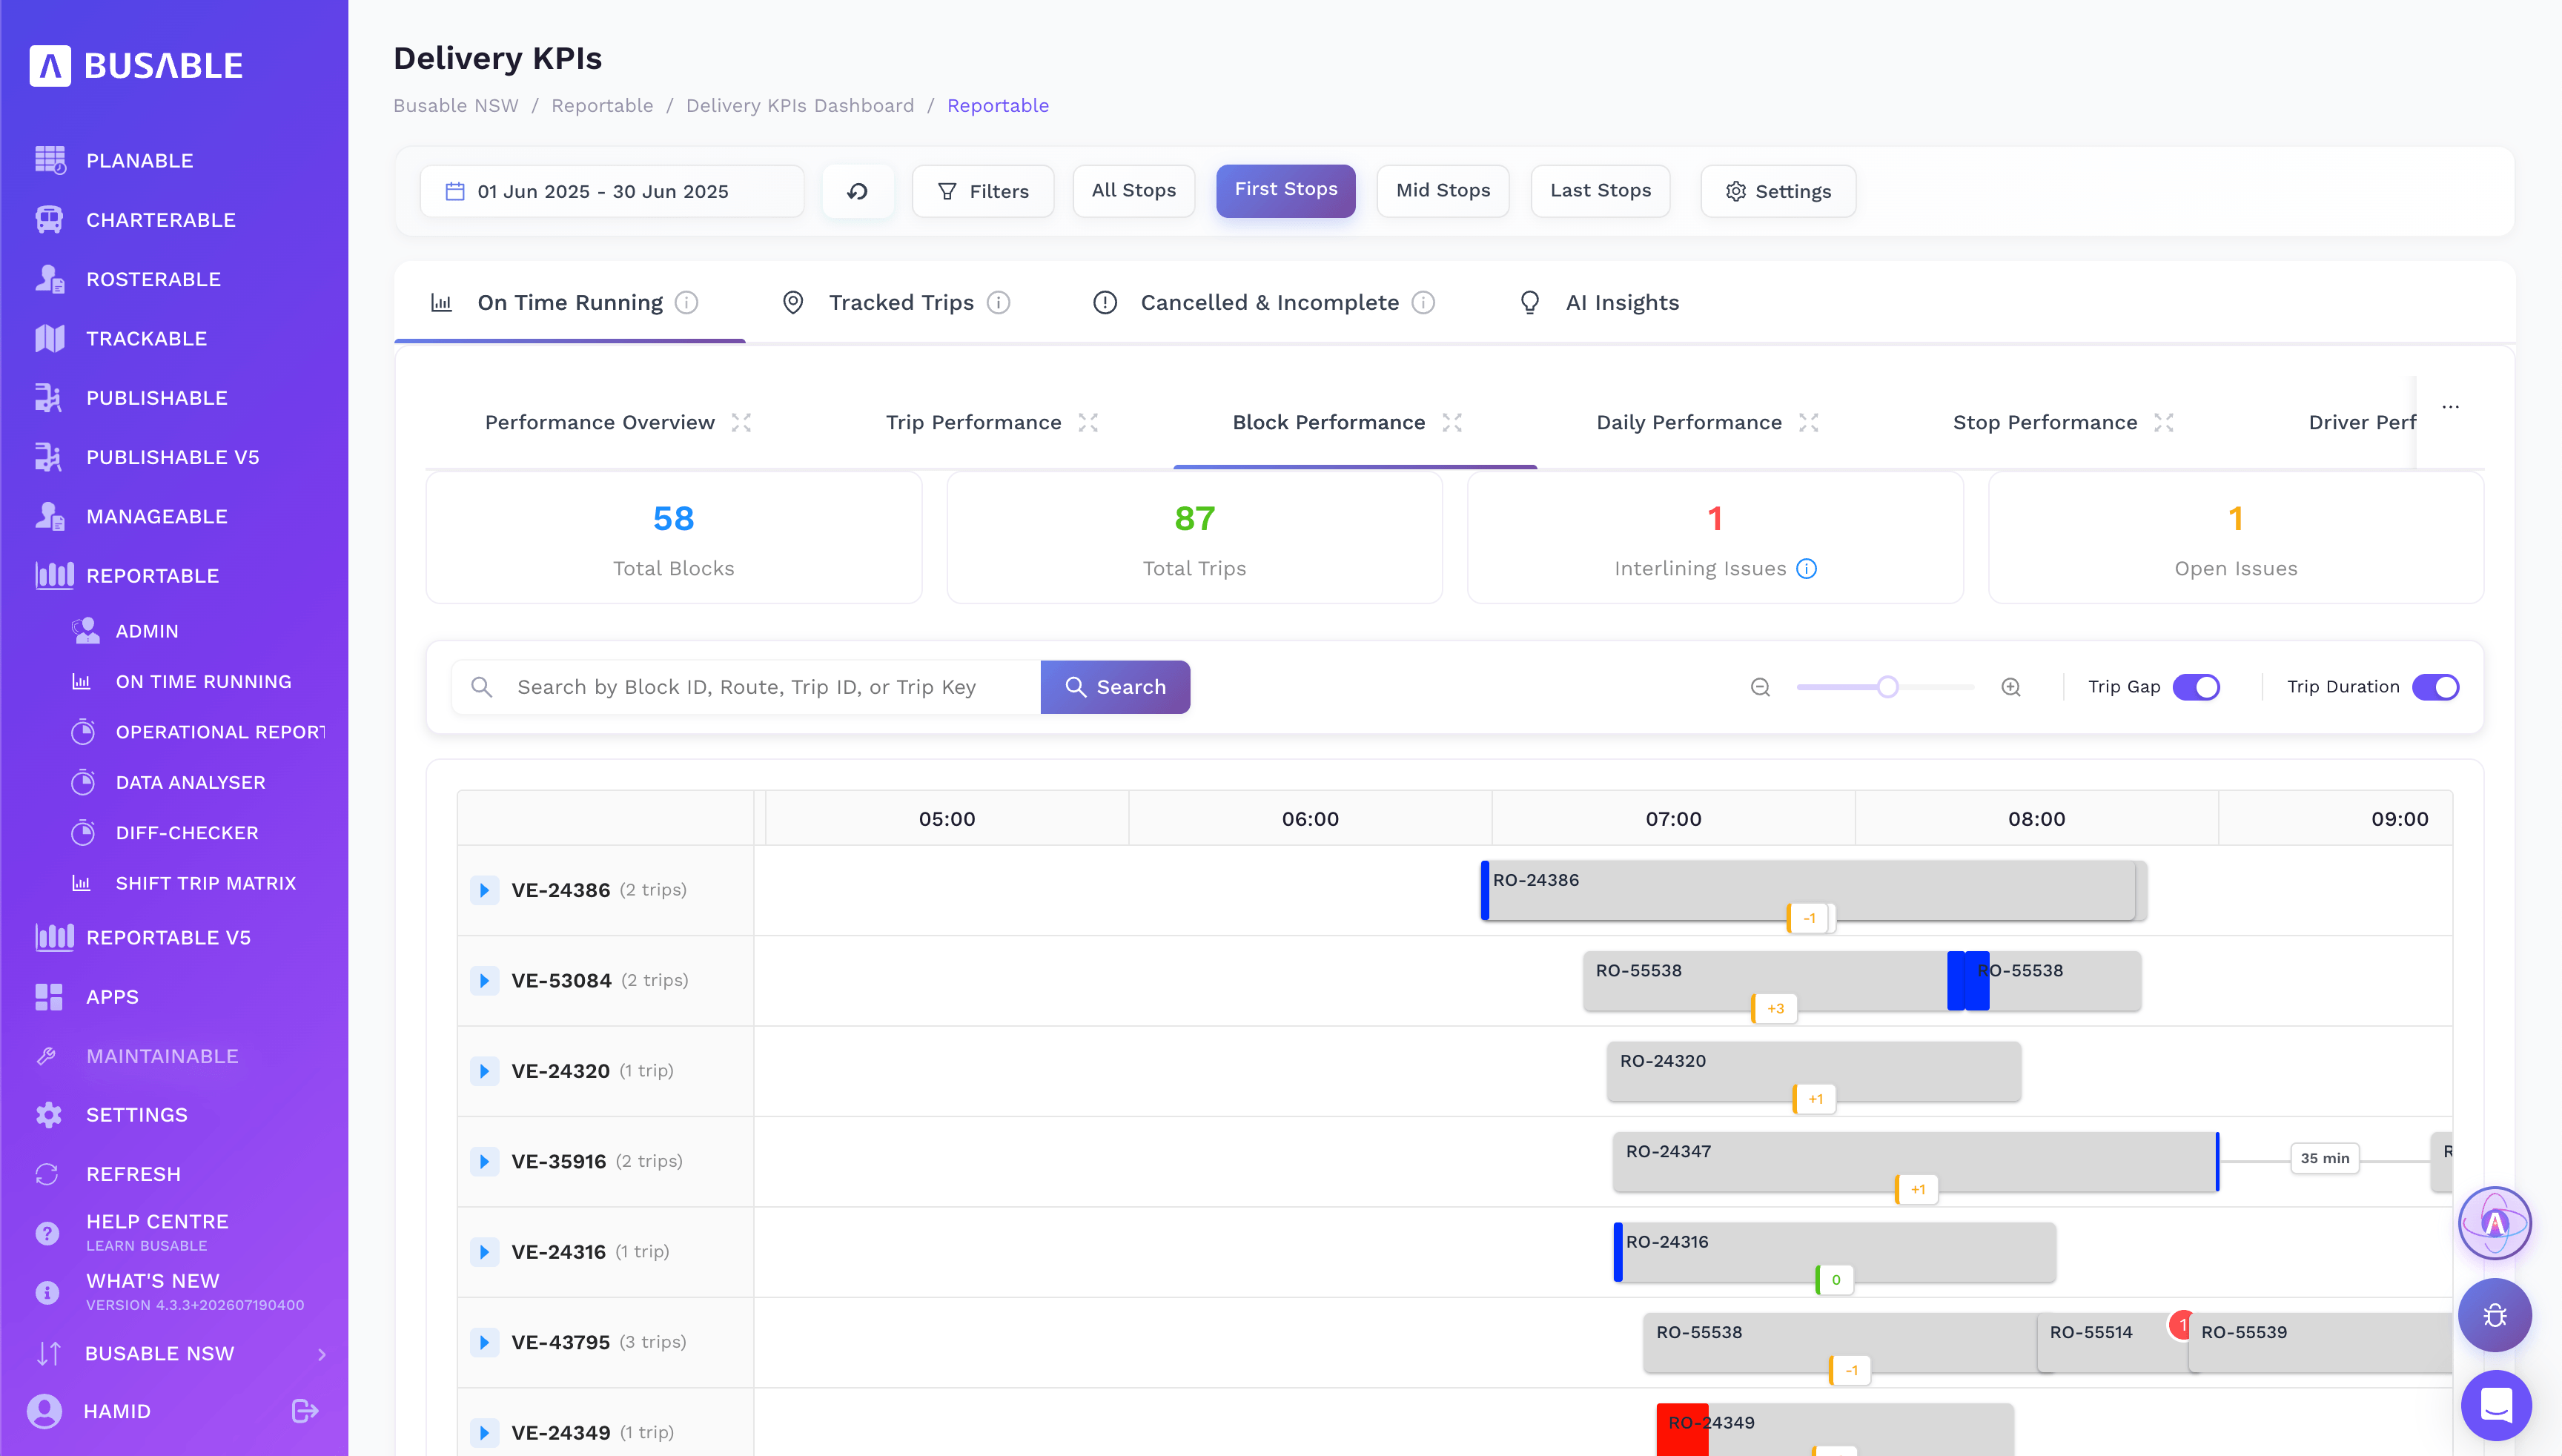
Every vehicle block on a timeline — trip gaps, durations and interlining issues laid out across the day.
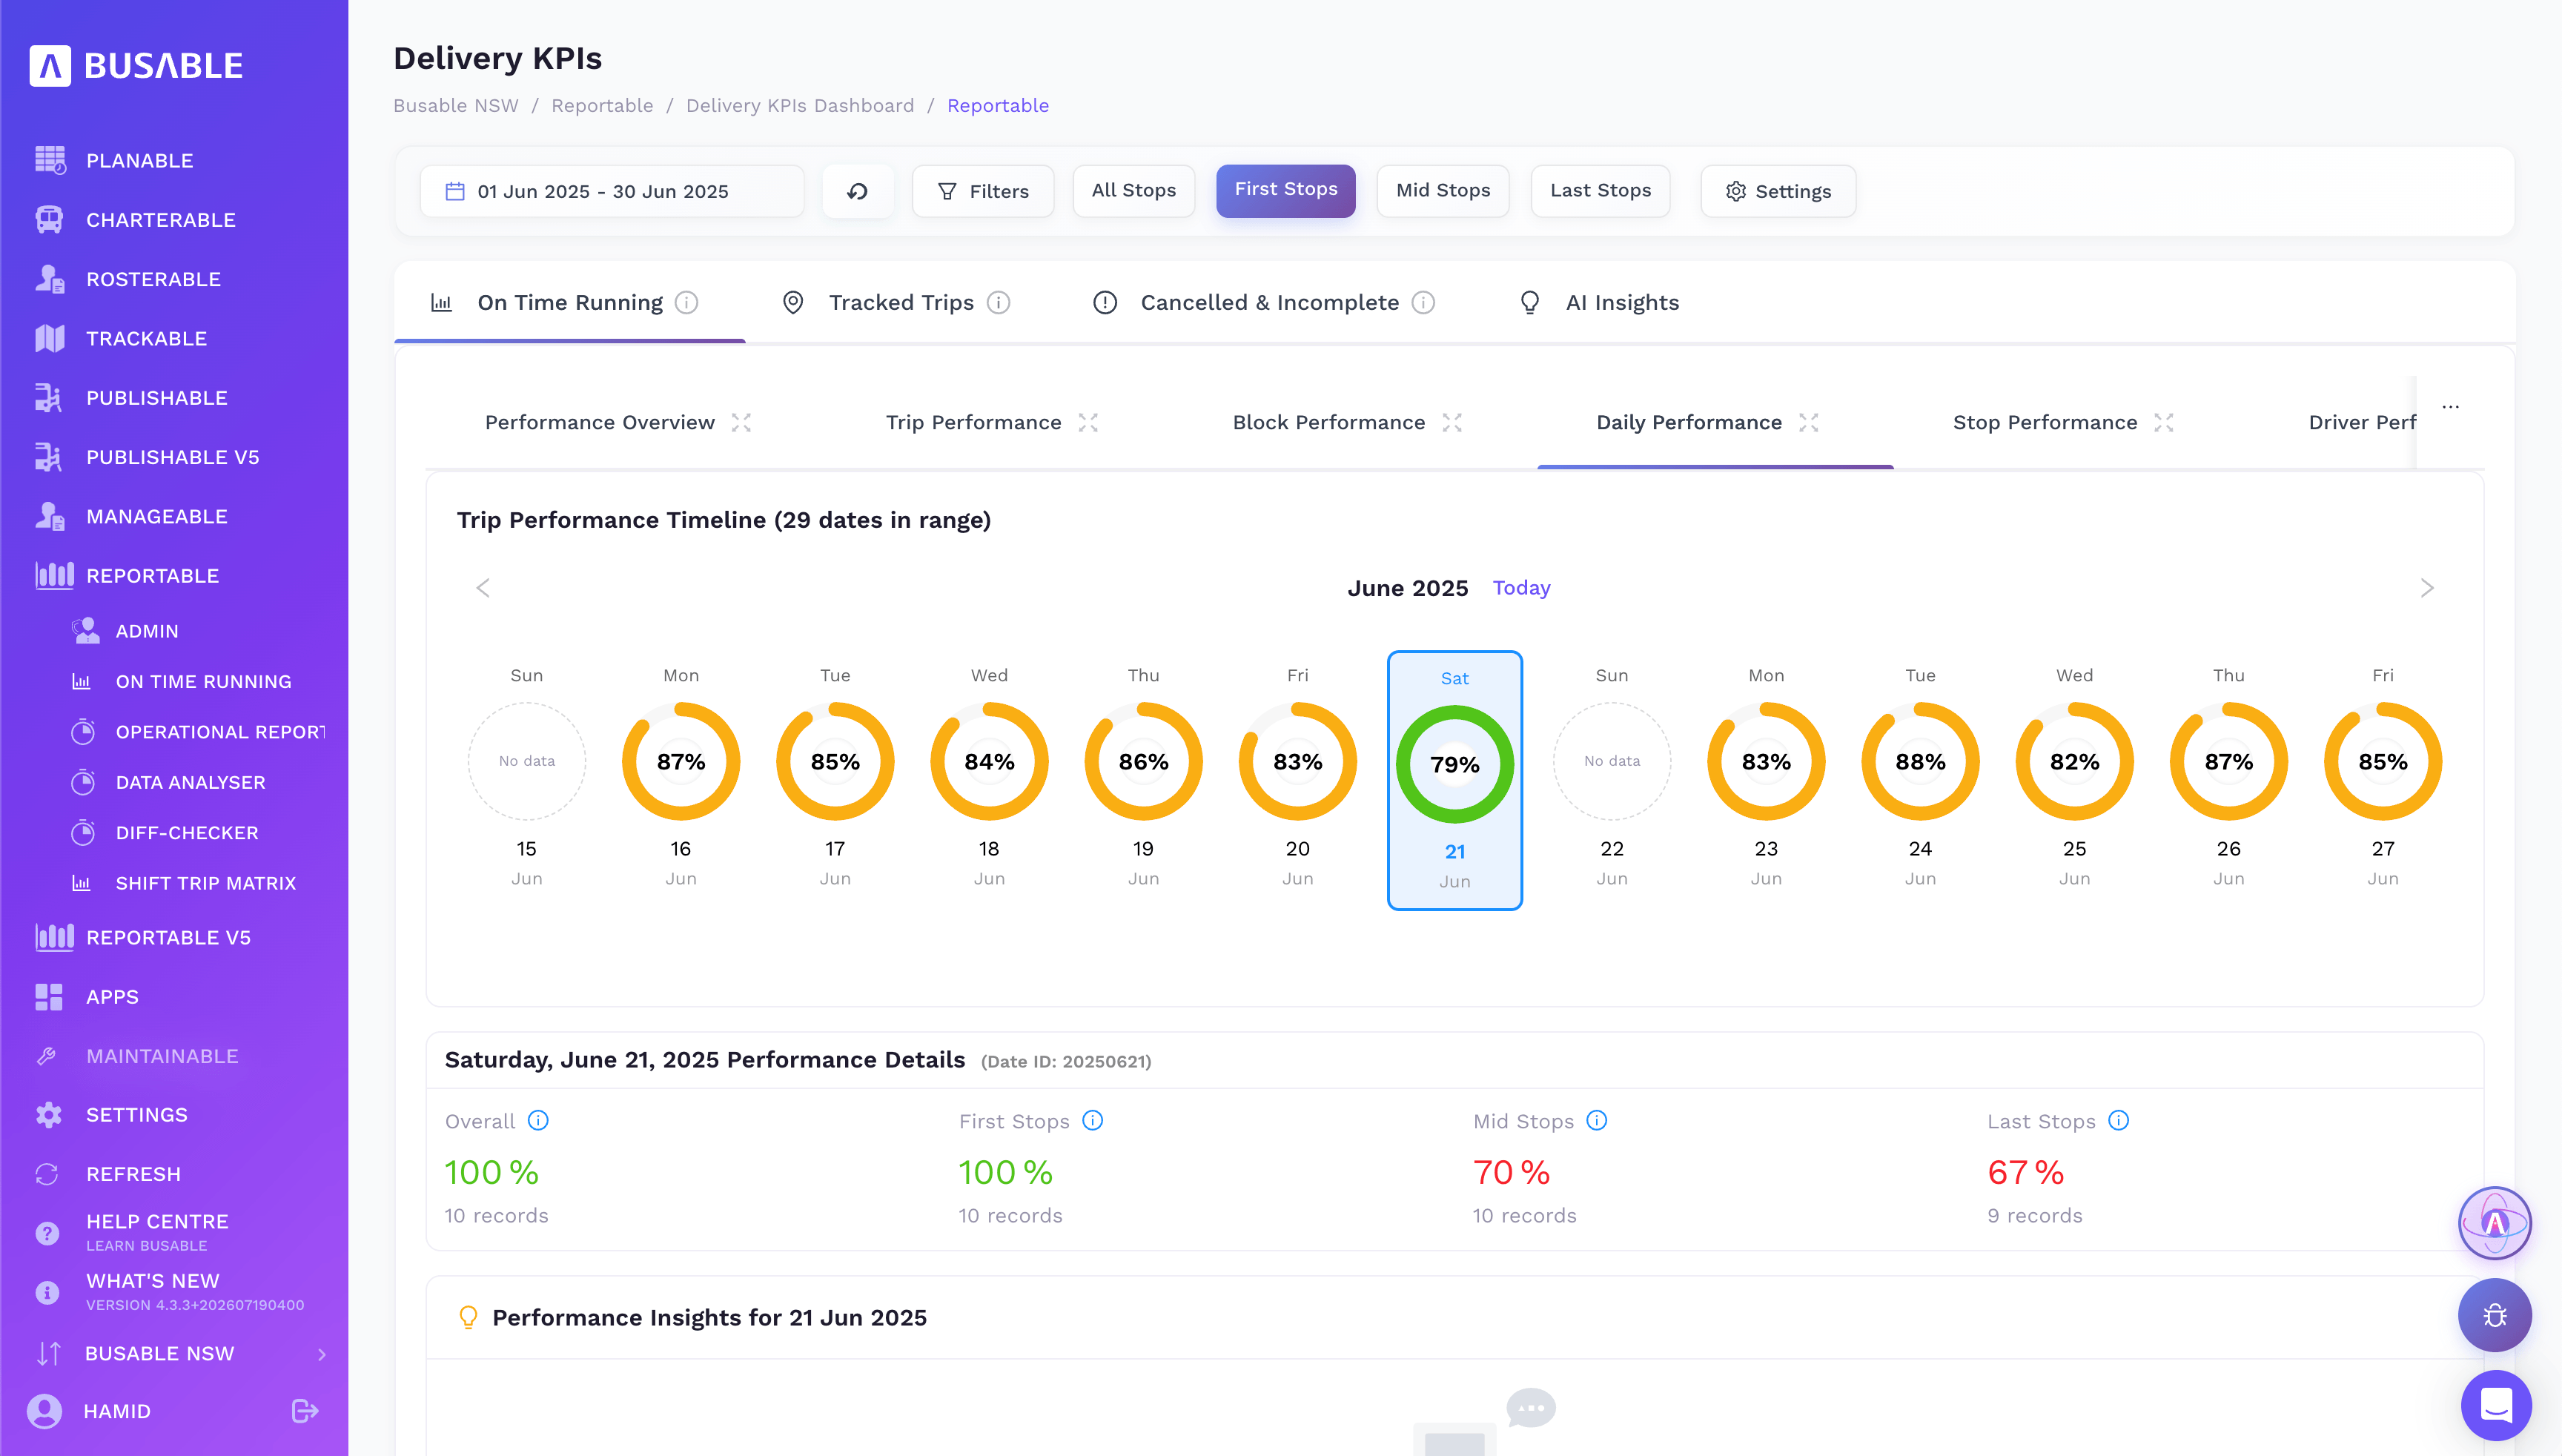
A ring for every day in the range, then the day's numbers split by first, mid and last stops.
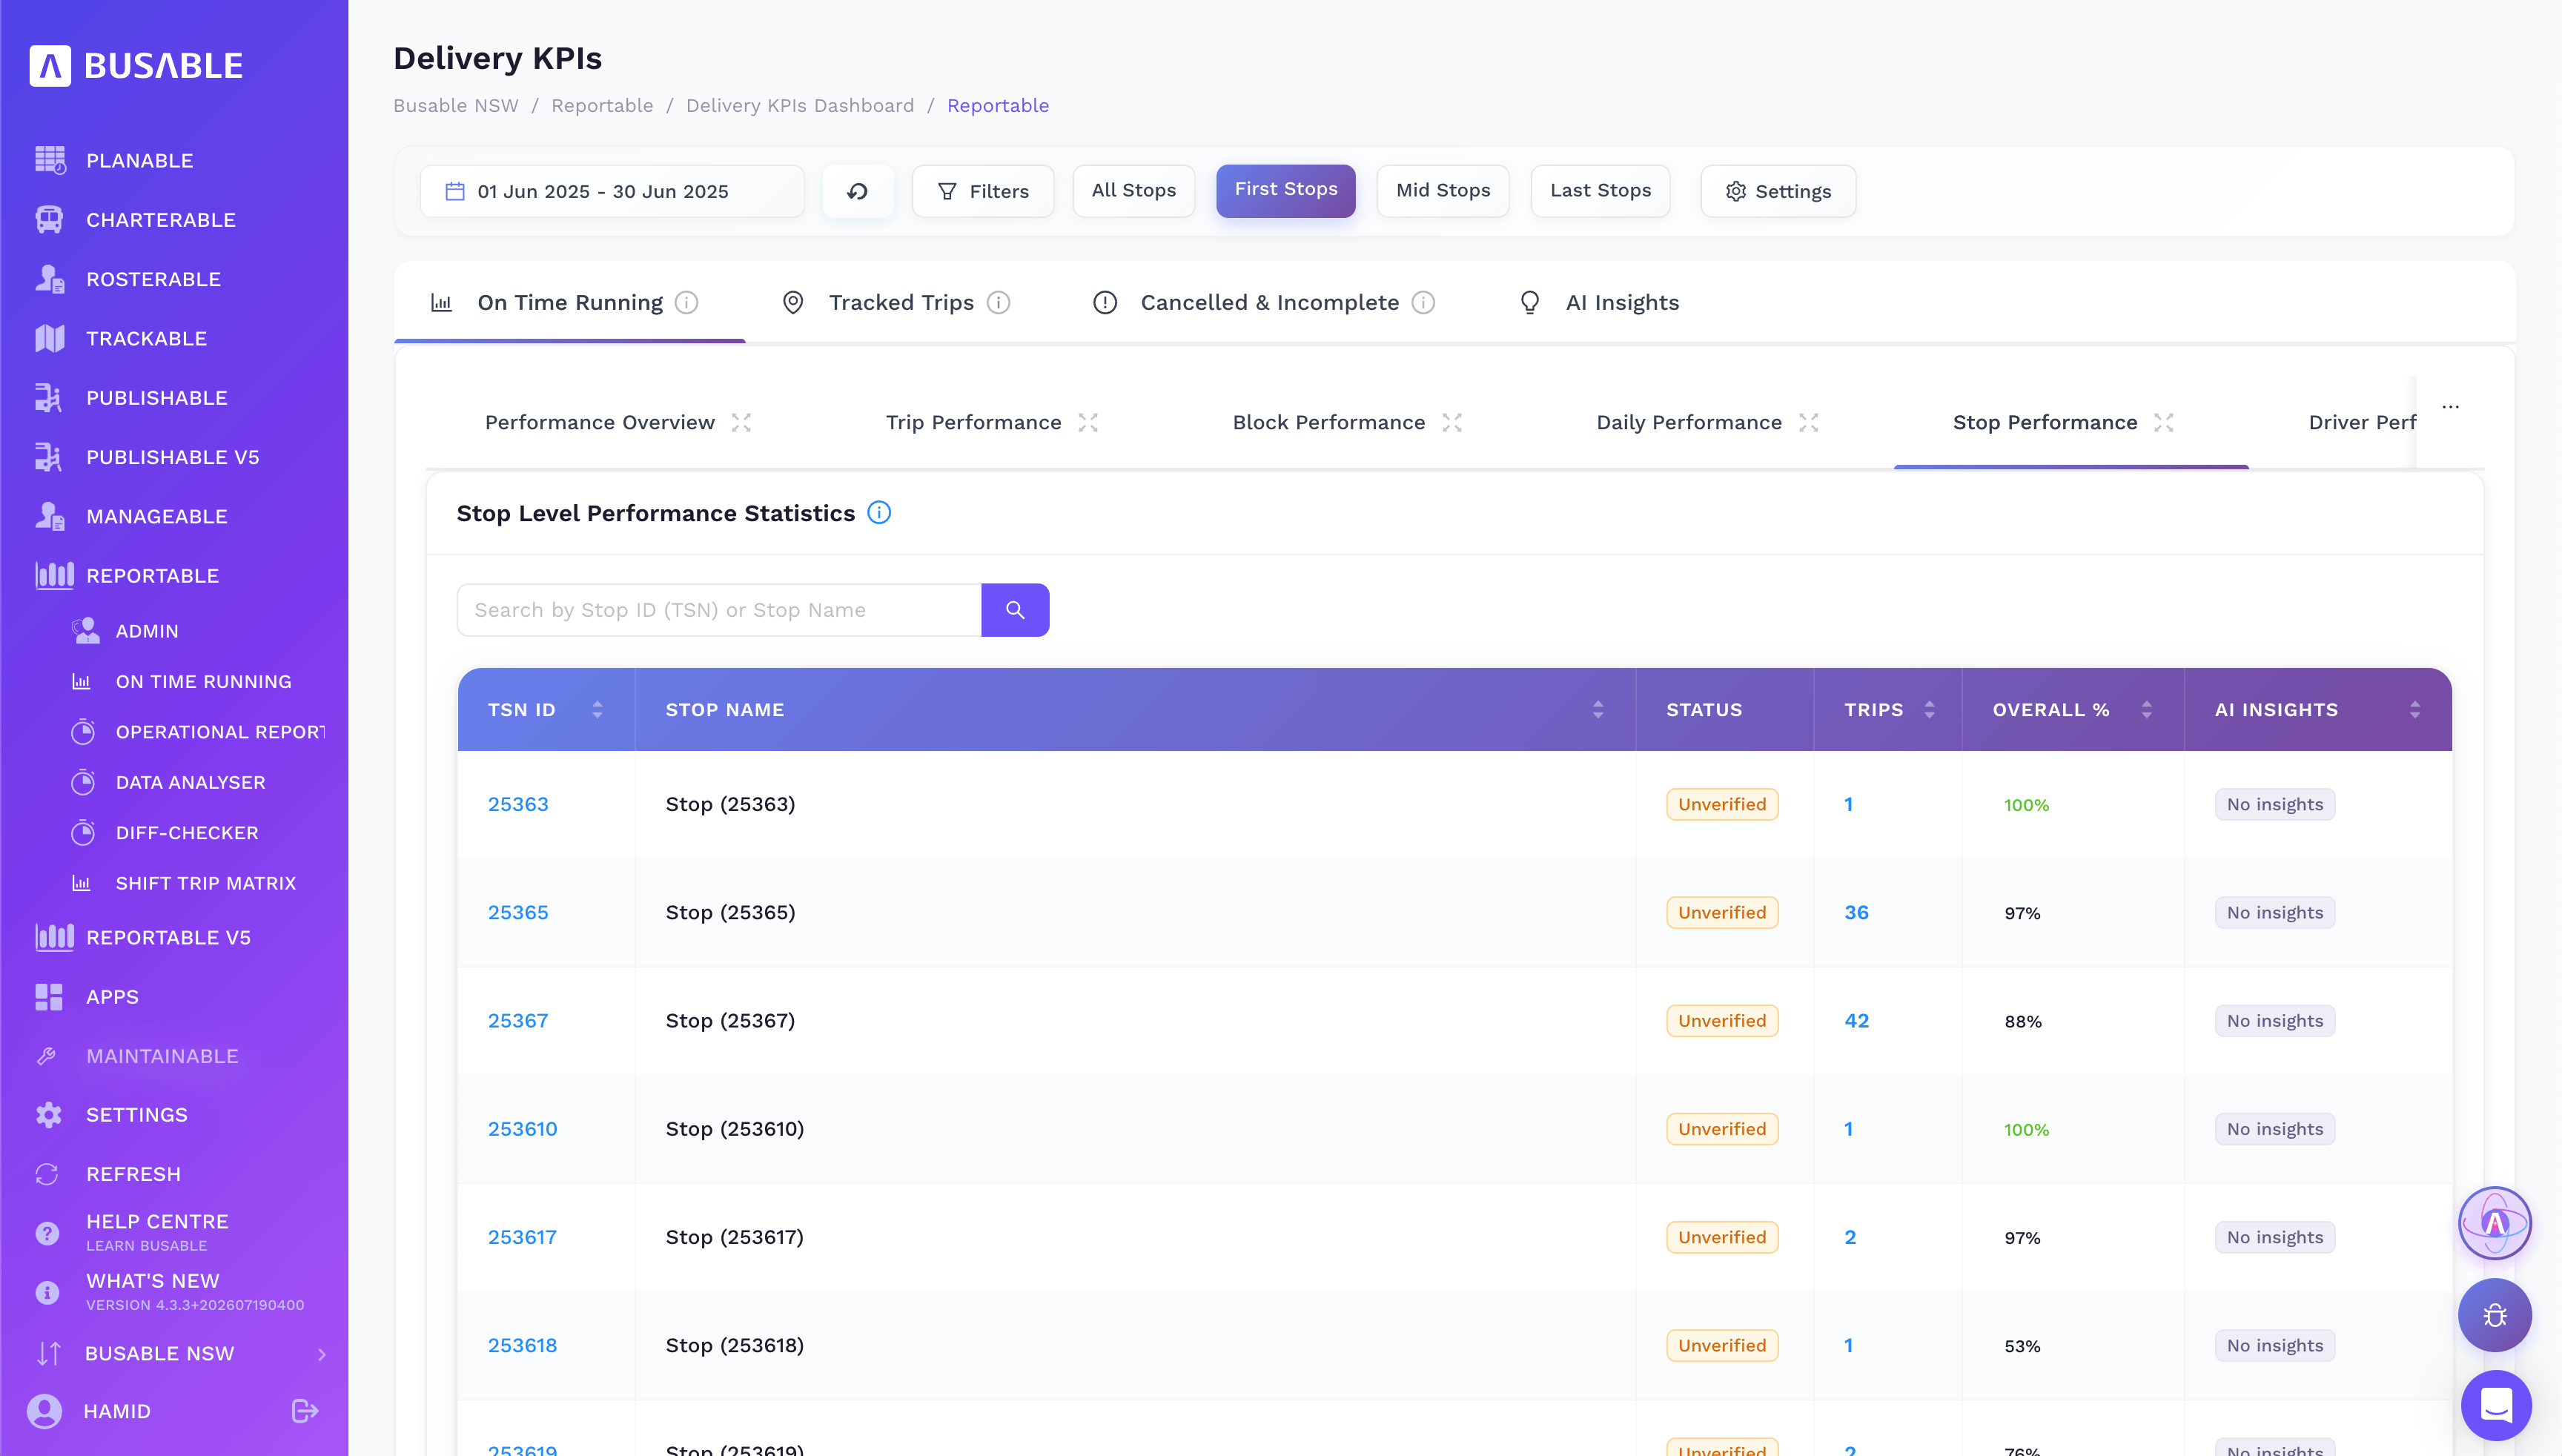
Stop-level statistics by TSN — trips served and overall on-time percentage for each.
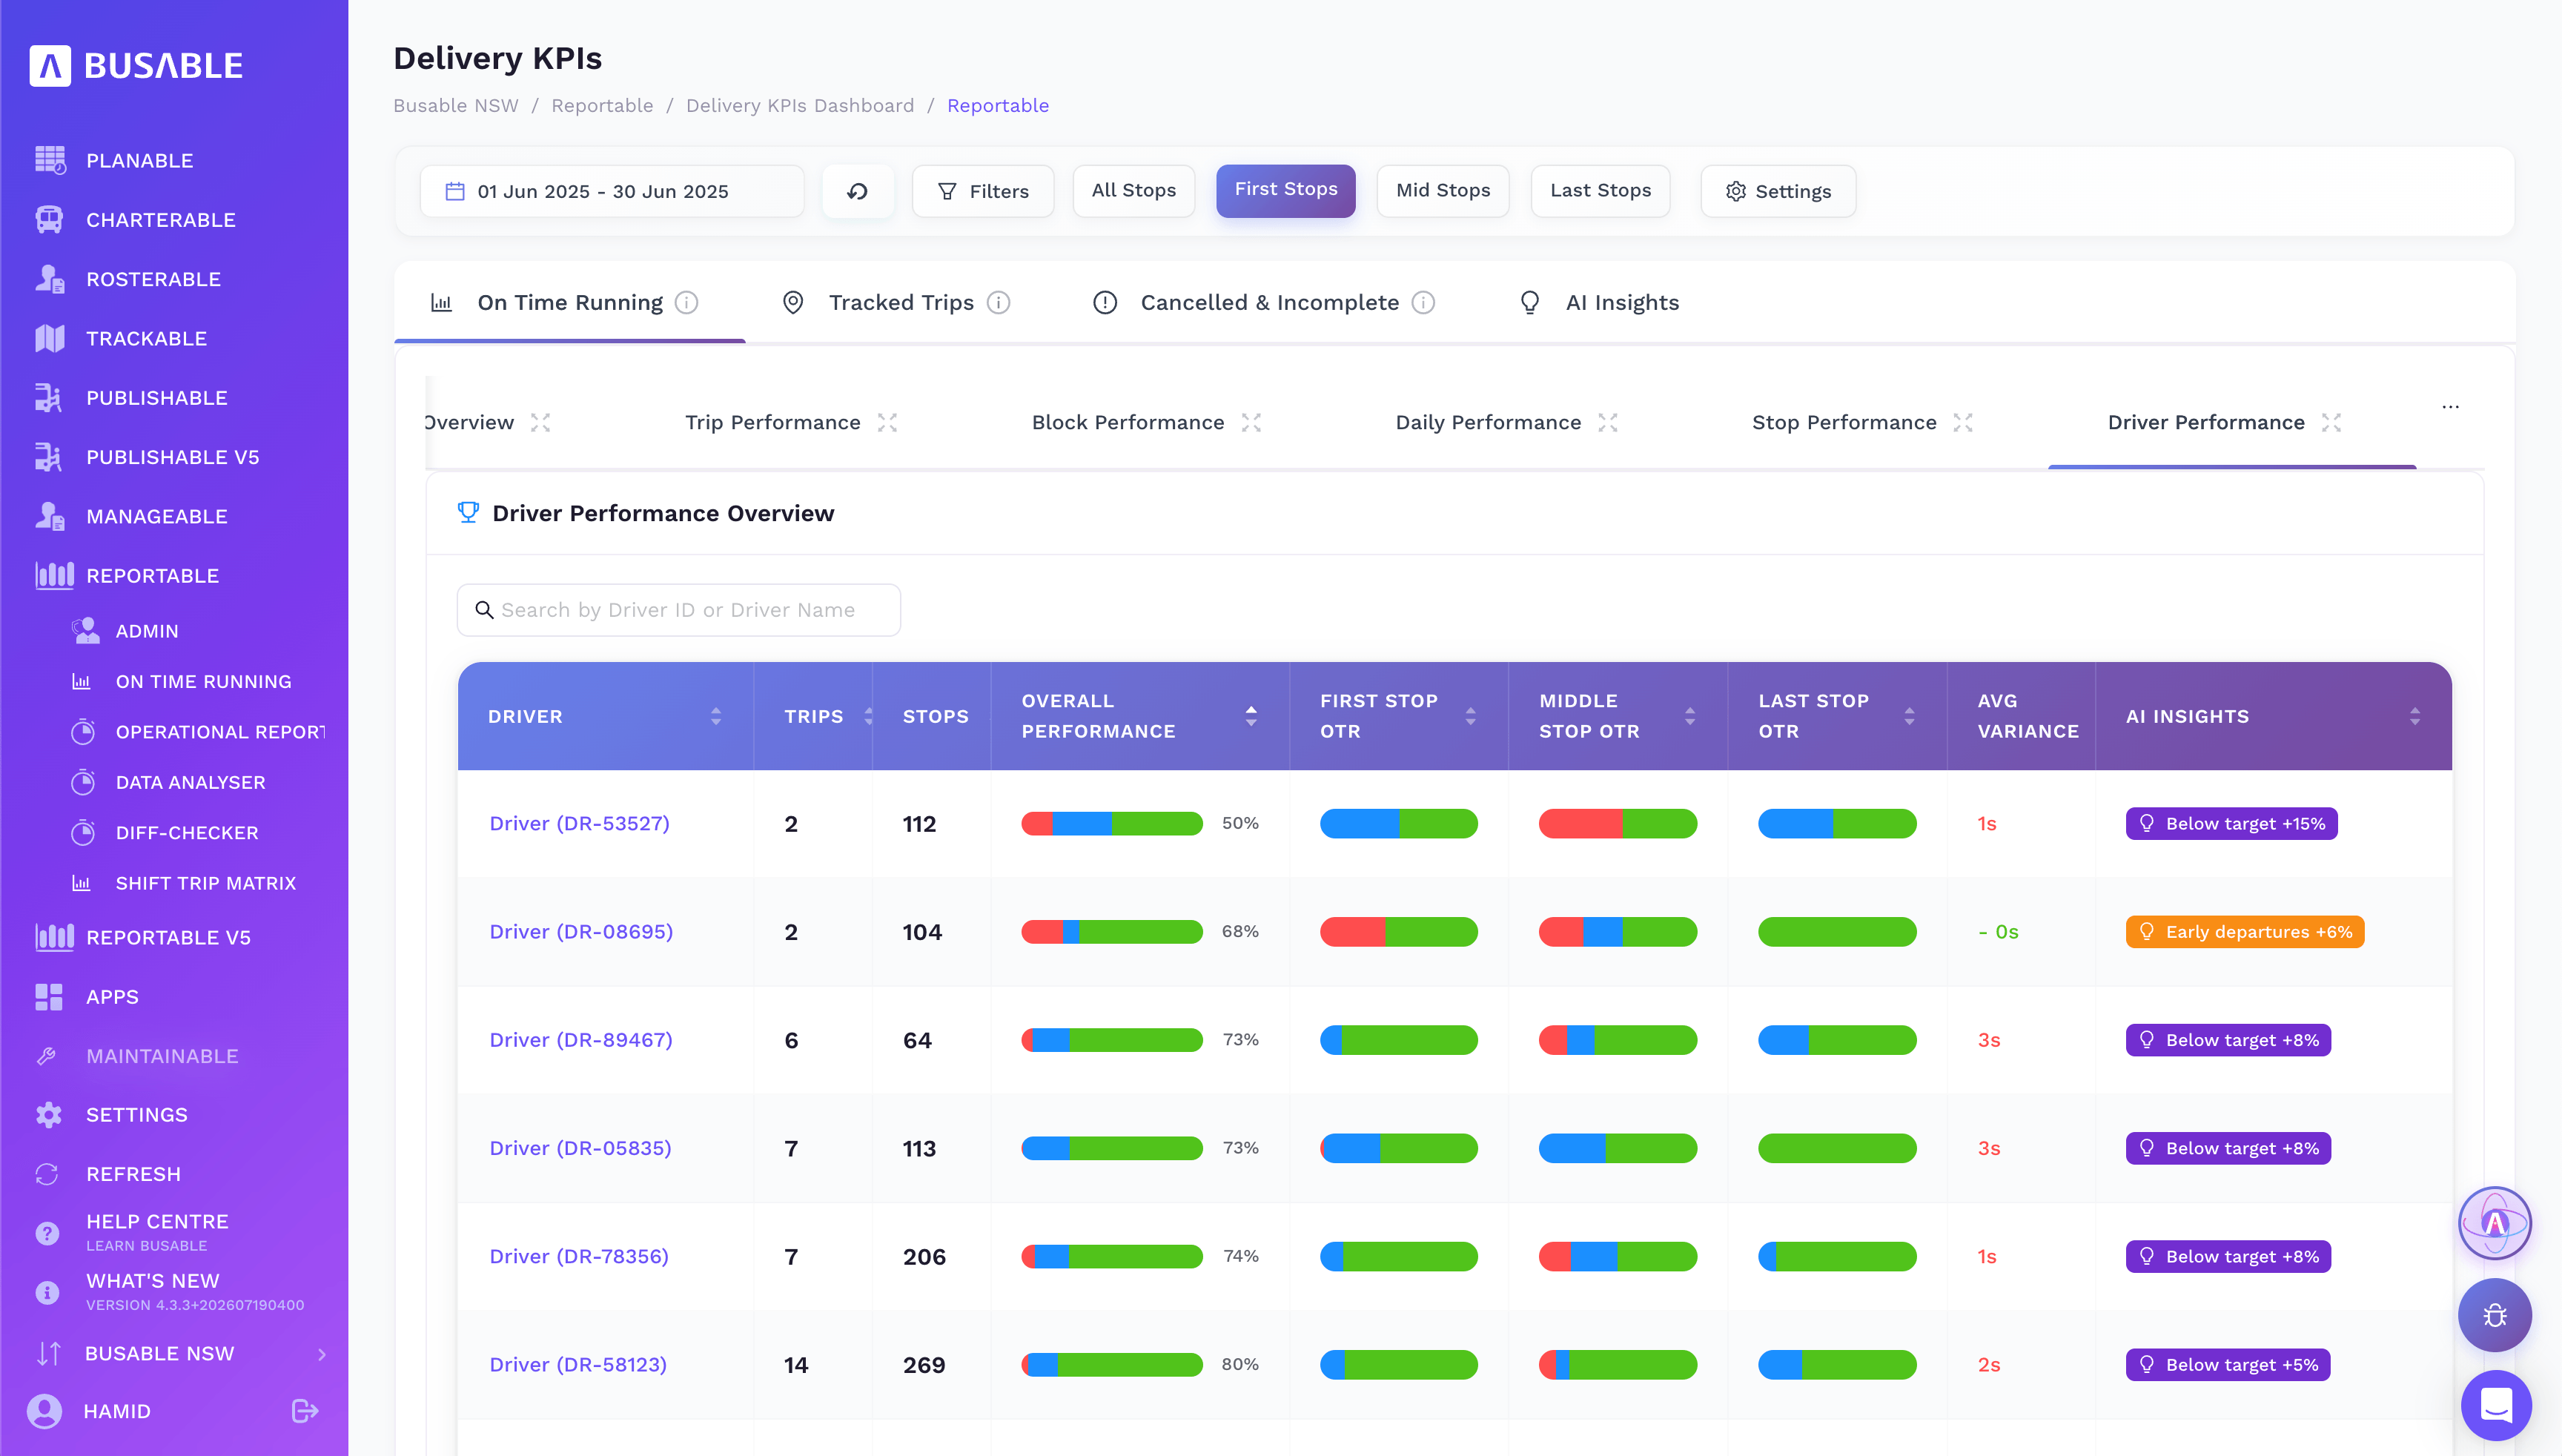
Per-driver OTR across first, mid and last stops, average variance, and where each sits against target.
Tracking coverage across the network — how many stops came back with GPS, how many didn't, and whether that's trending up.
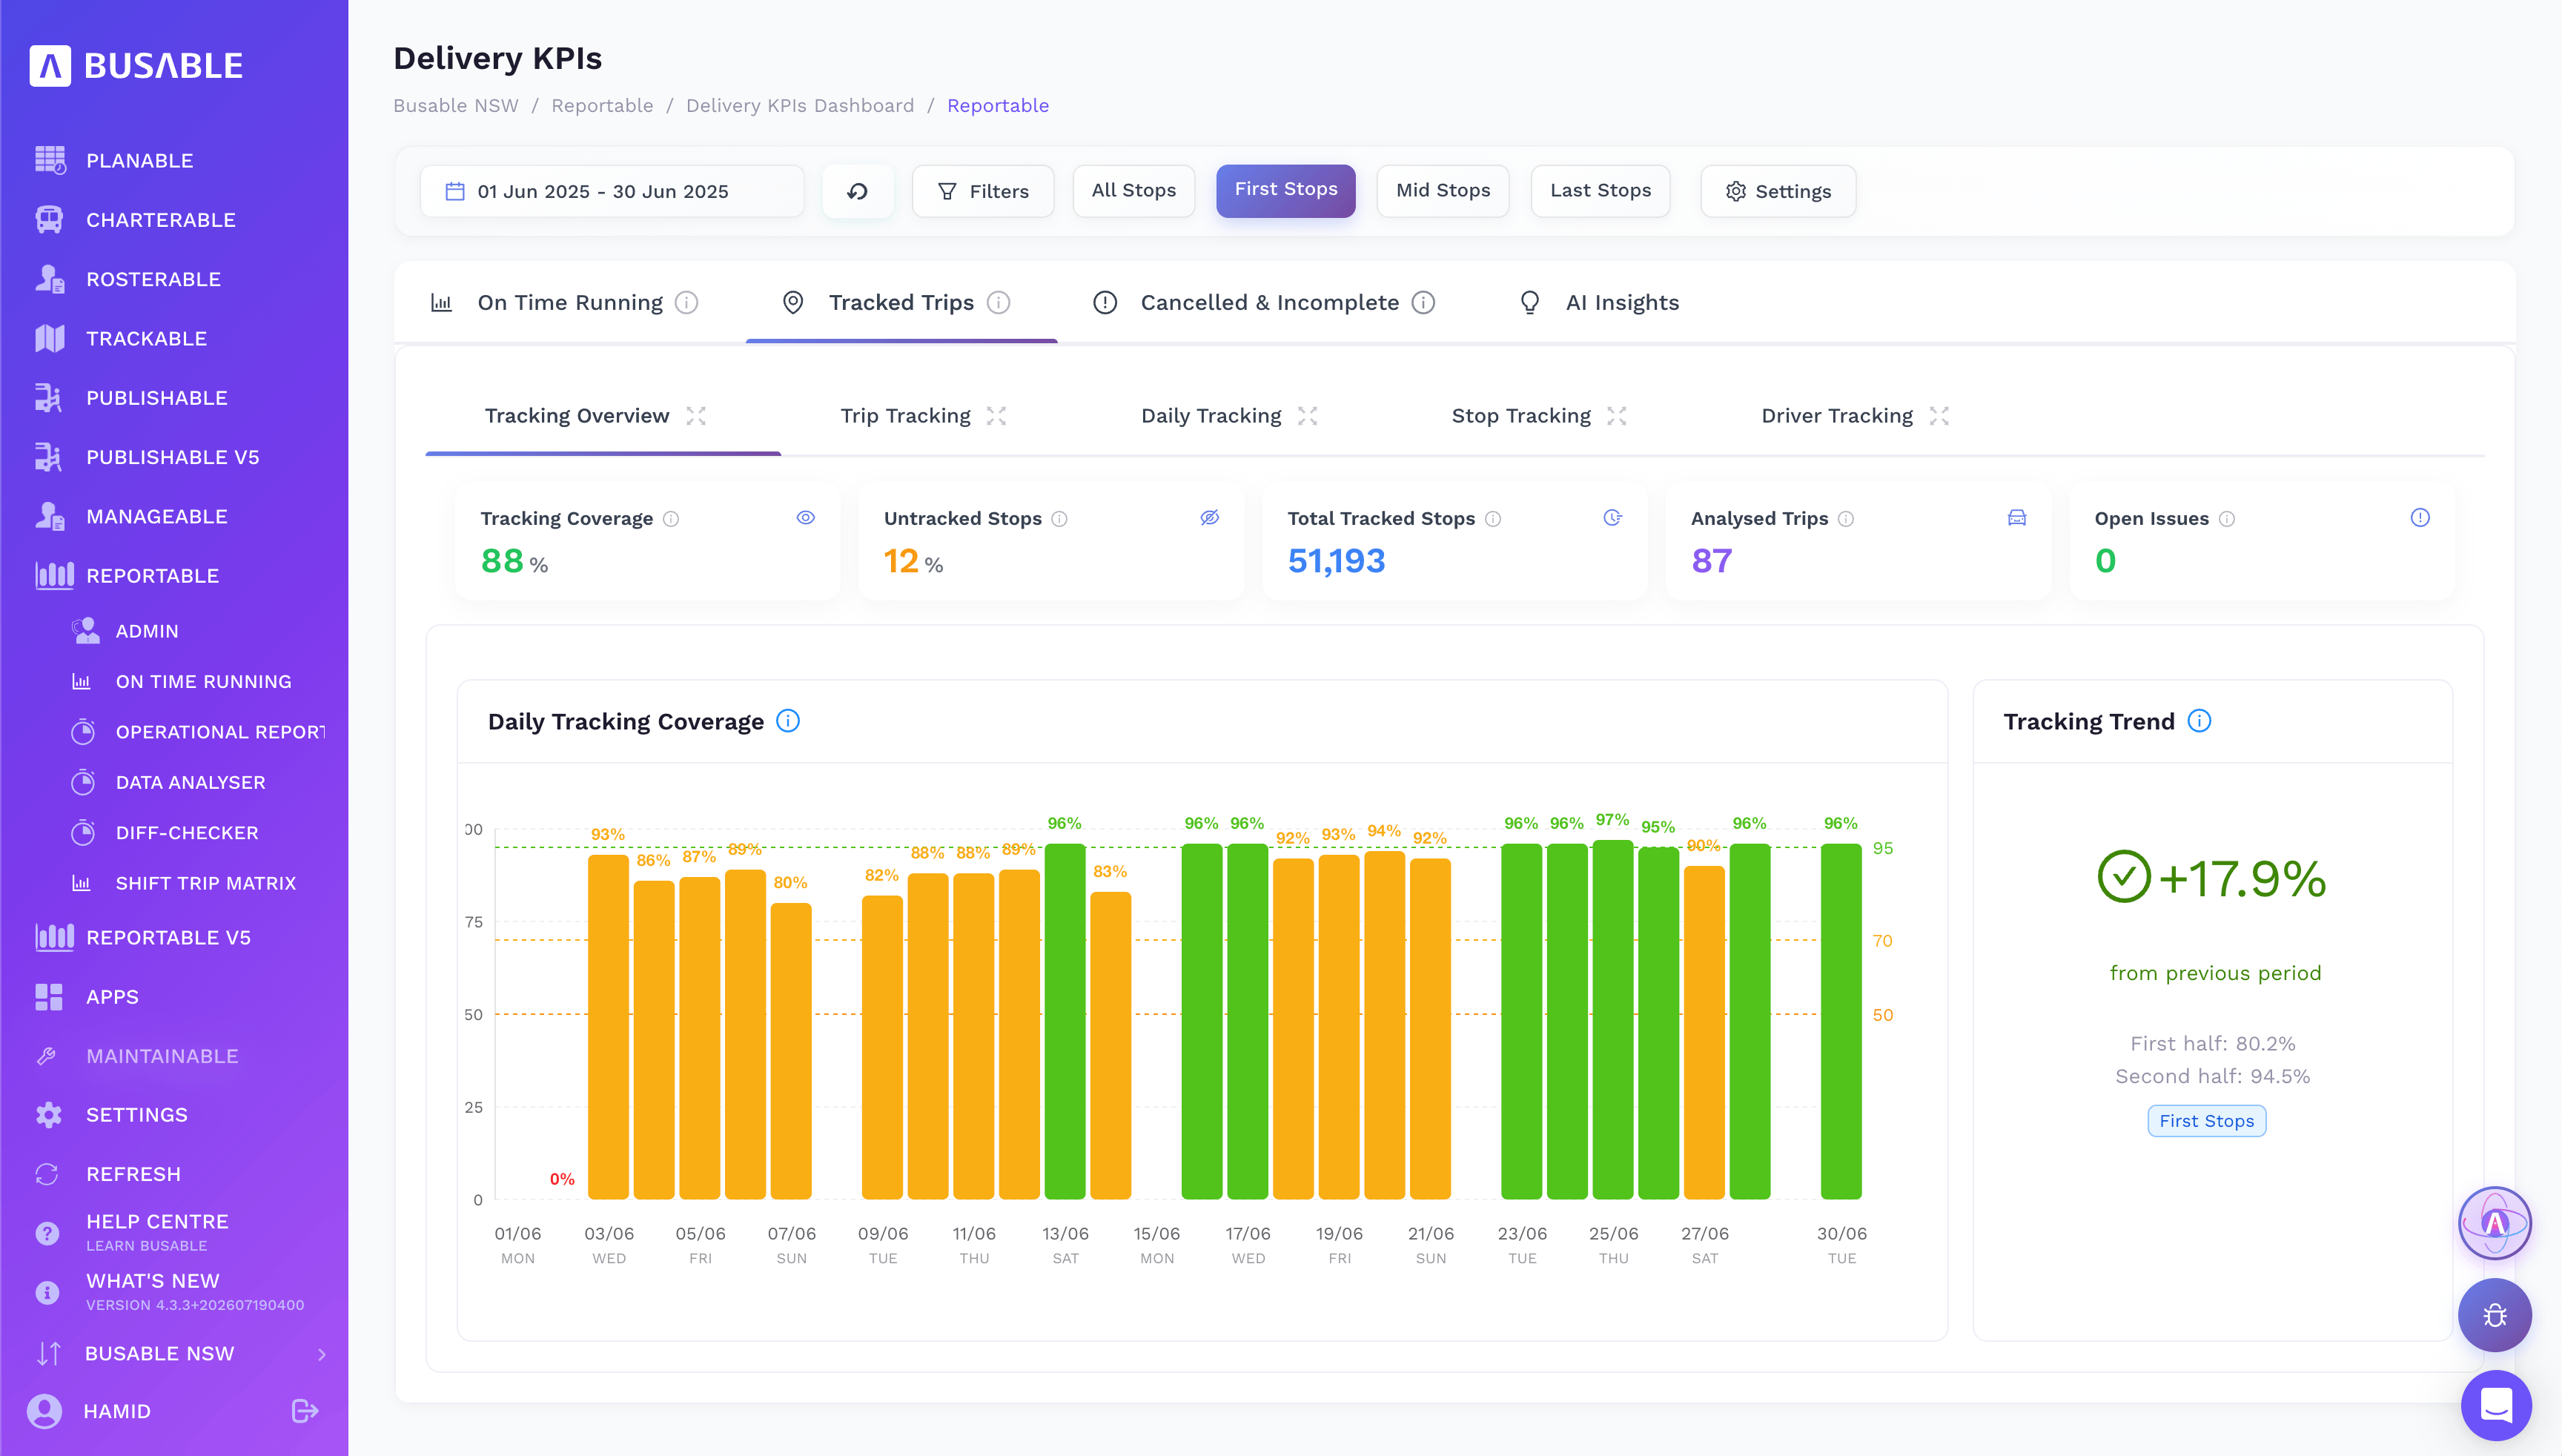
Coverage and untracked stops up top, the daily coverage chart below, and the trend against the previous period.
Cancelled and incomplete trips as a share of the total, measured against your KPI target — then the list of each, down to the trip, route and contract.
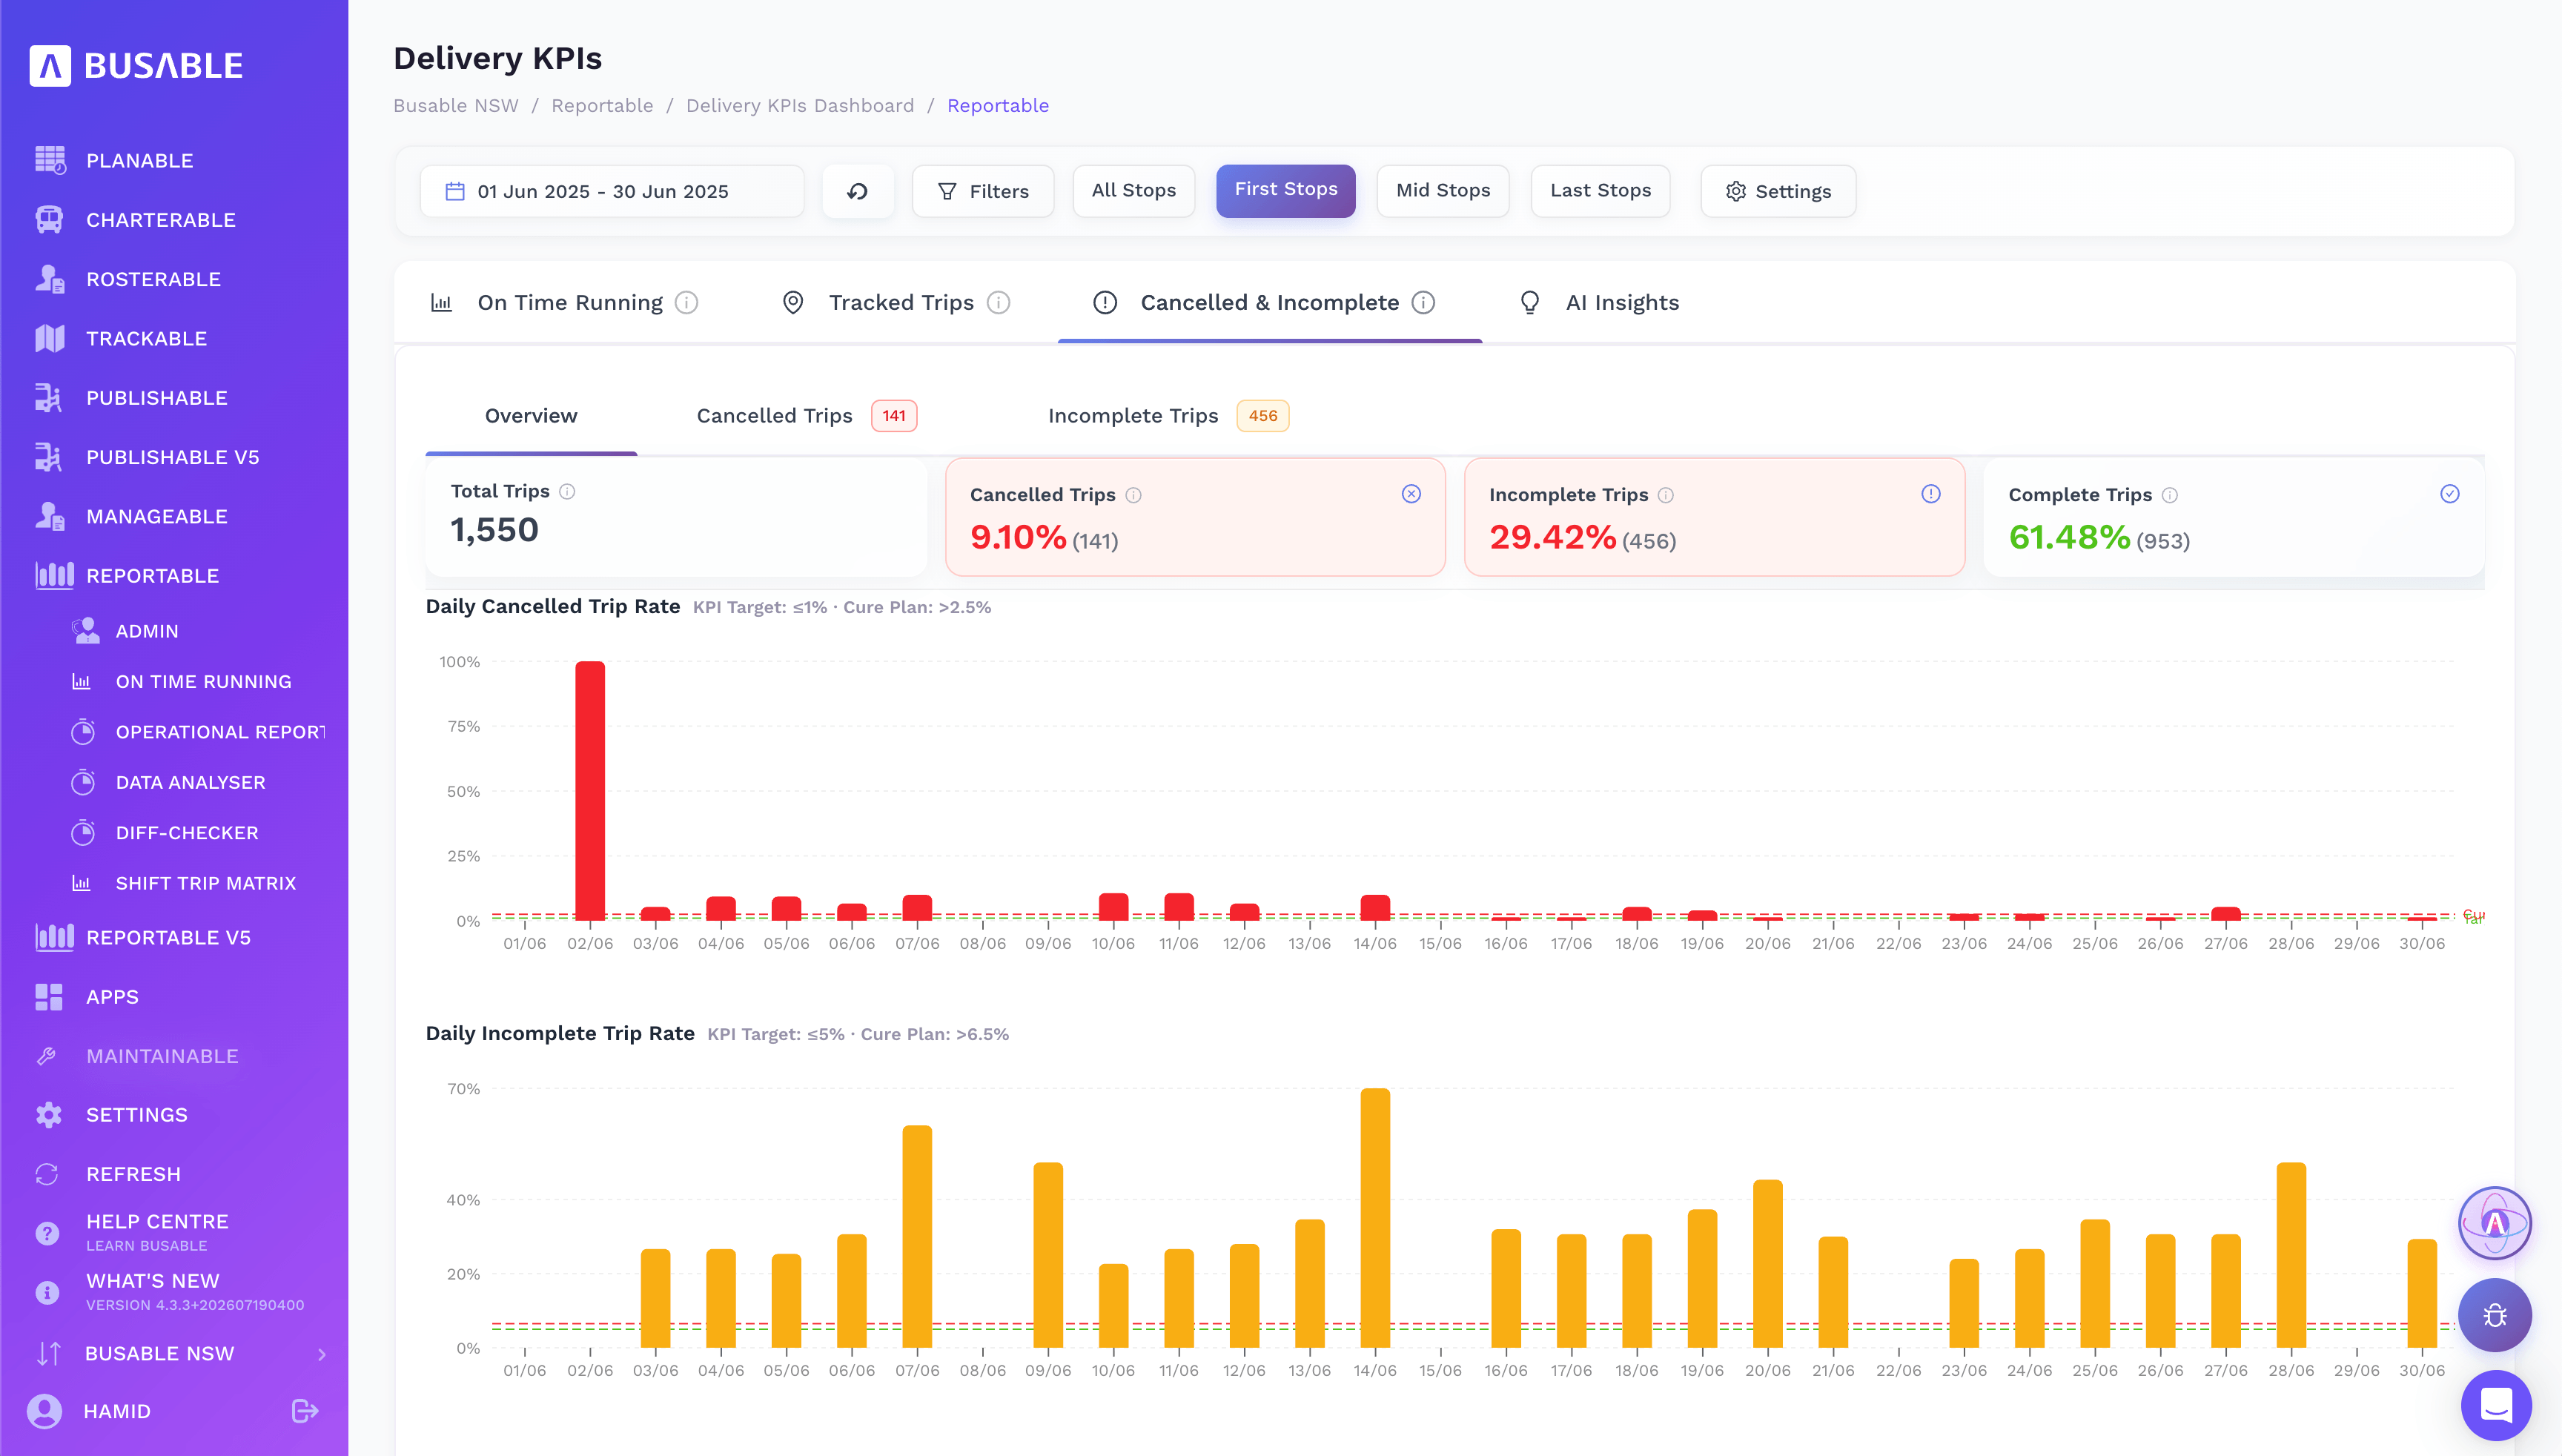
Cancelled, incomplete and complete rates against the KPI target, with a daily rate chart for each.
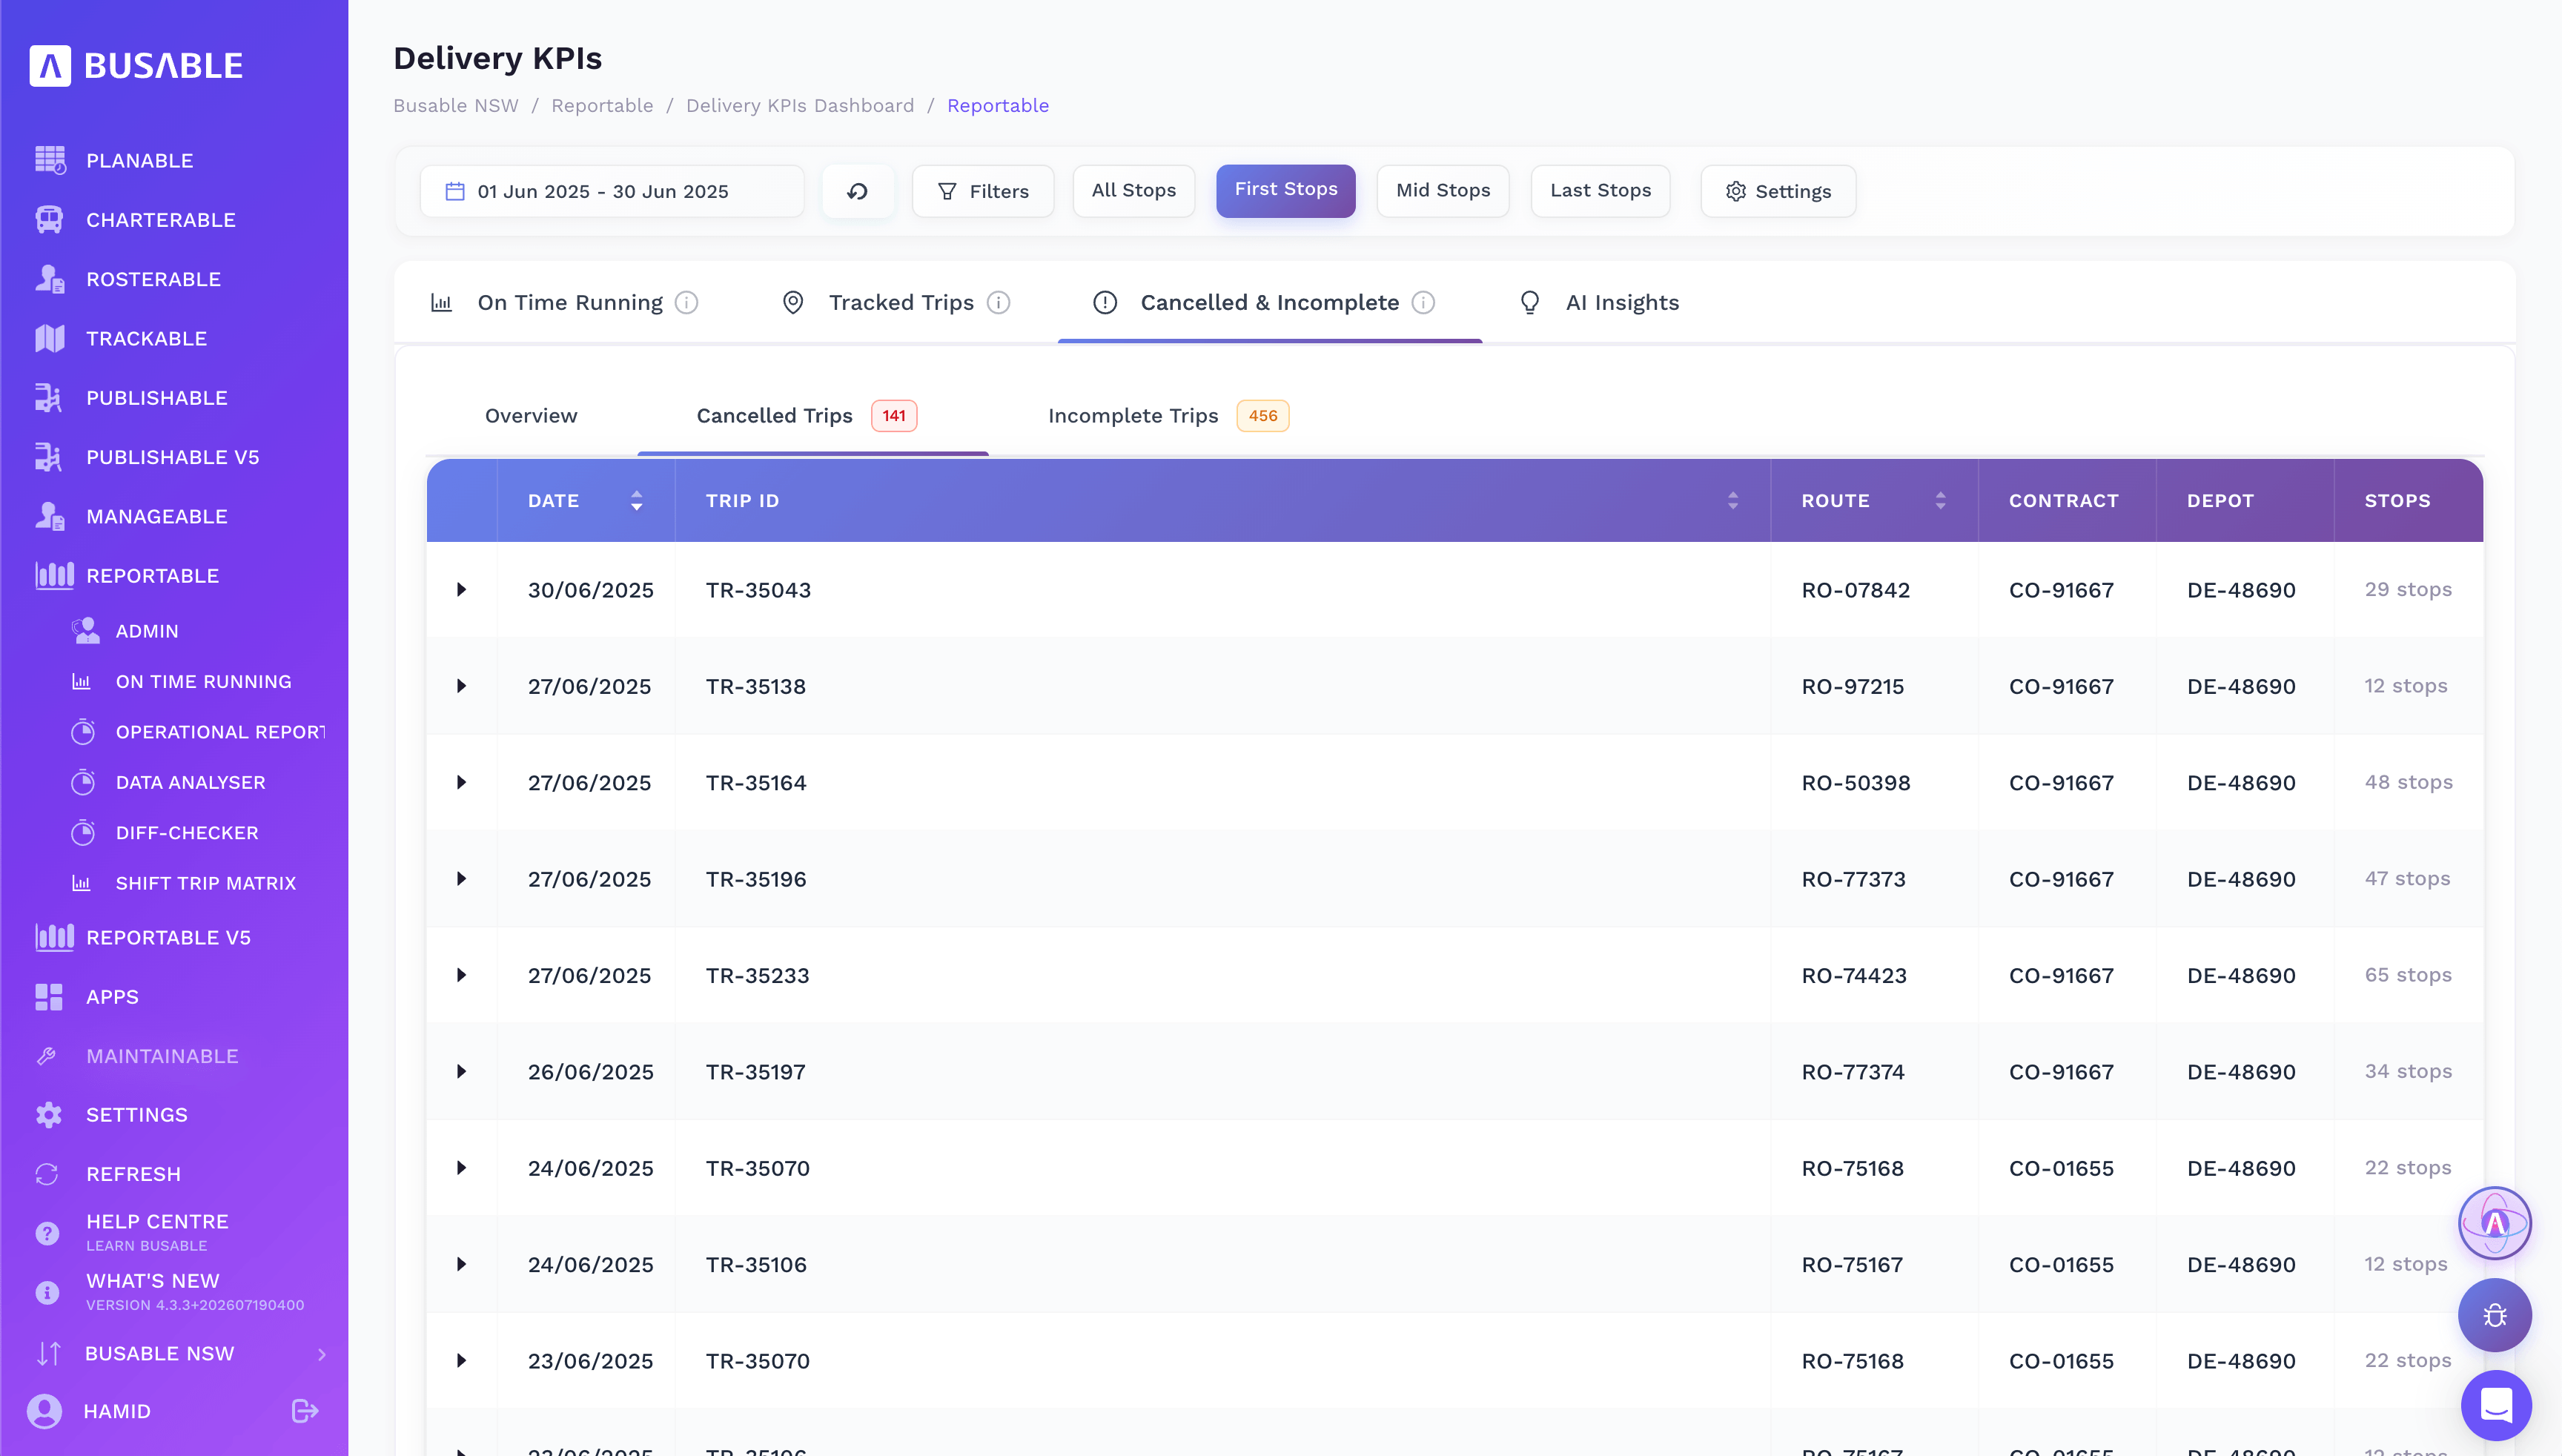
Date, trip, route, contract and depot for each one — ready to explain at contract review.
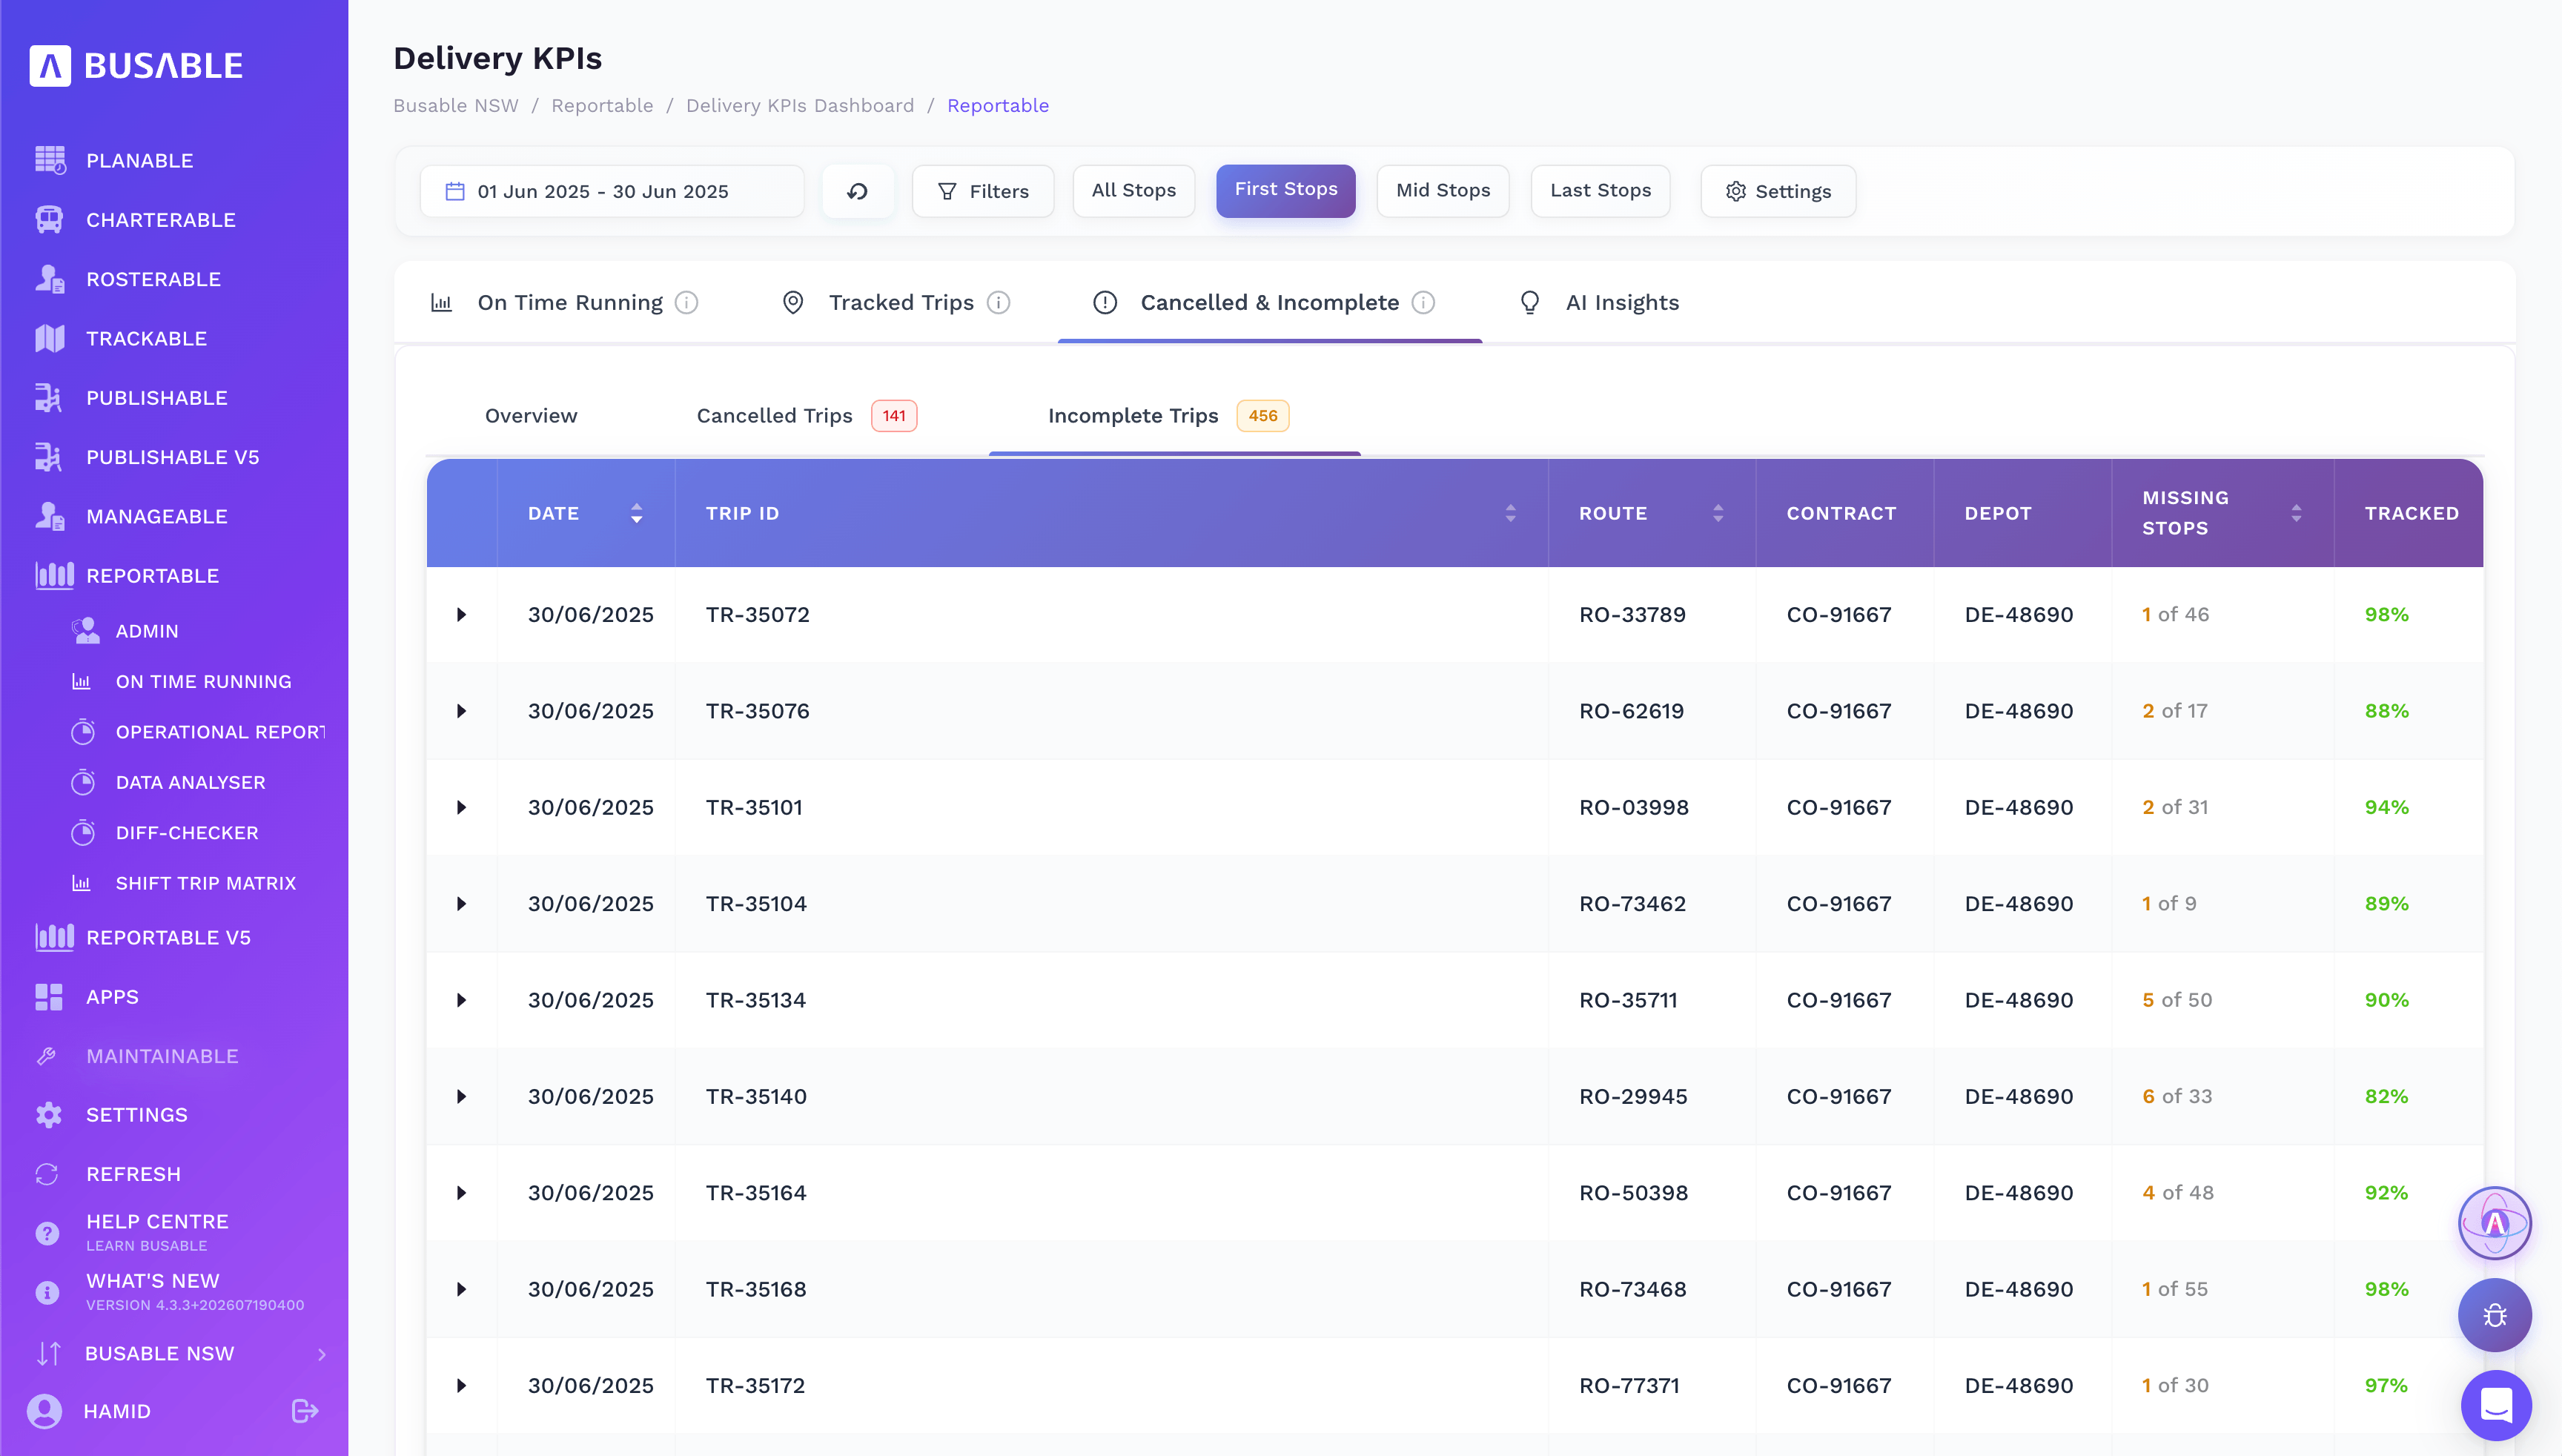
How many stops were missed out of the total, and how much of the trip was tracked.
AbleAI reads the period and tells you where you stand against target, then ranks the fixes — the near-miss stops and the handful of trips that move the number most.
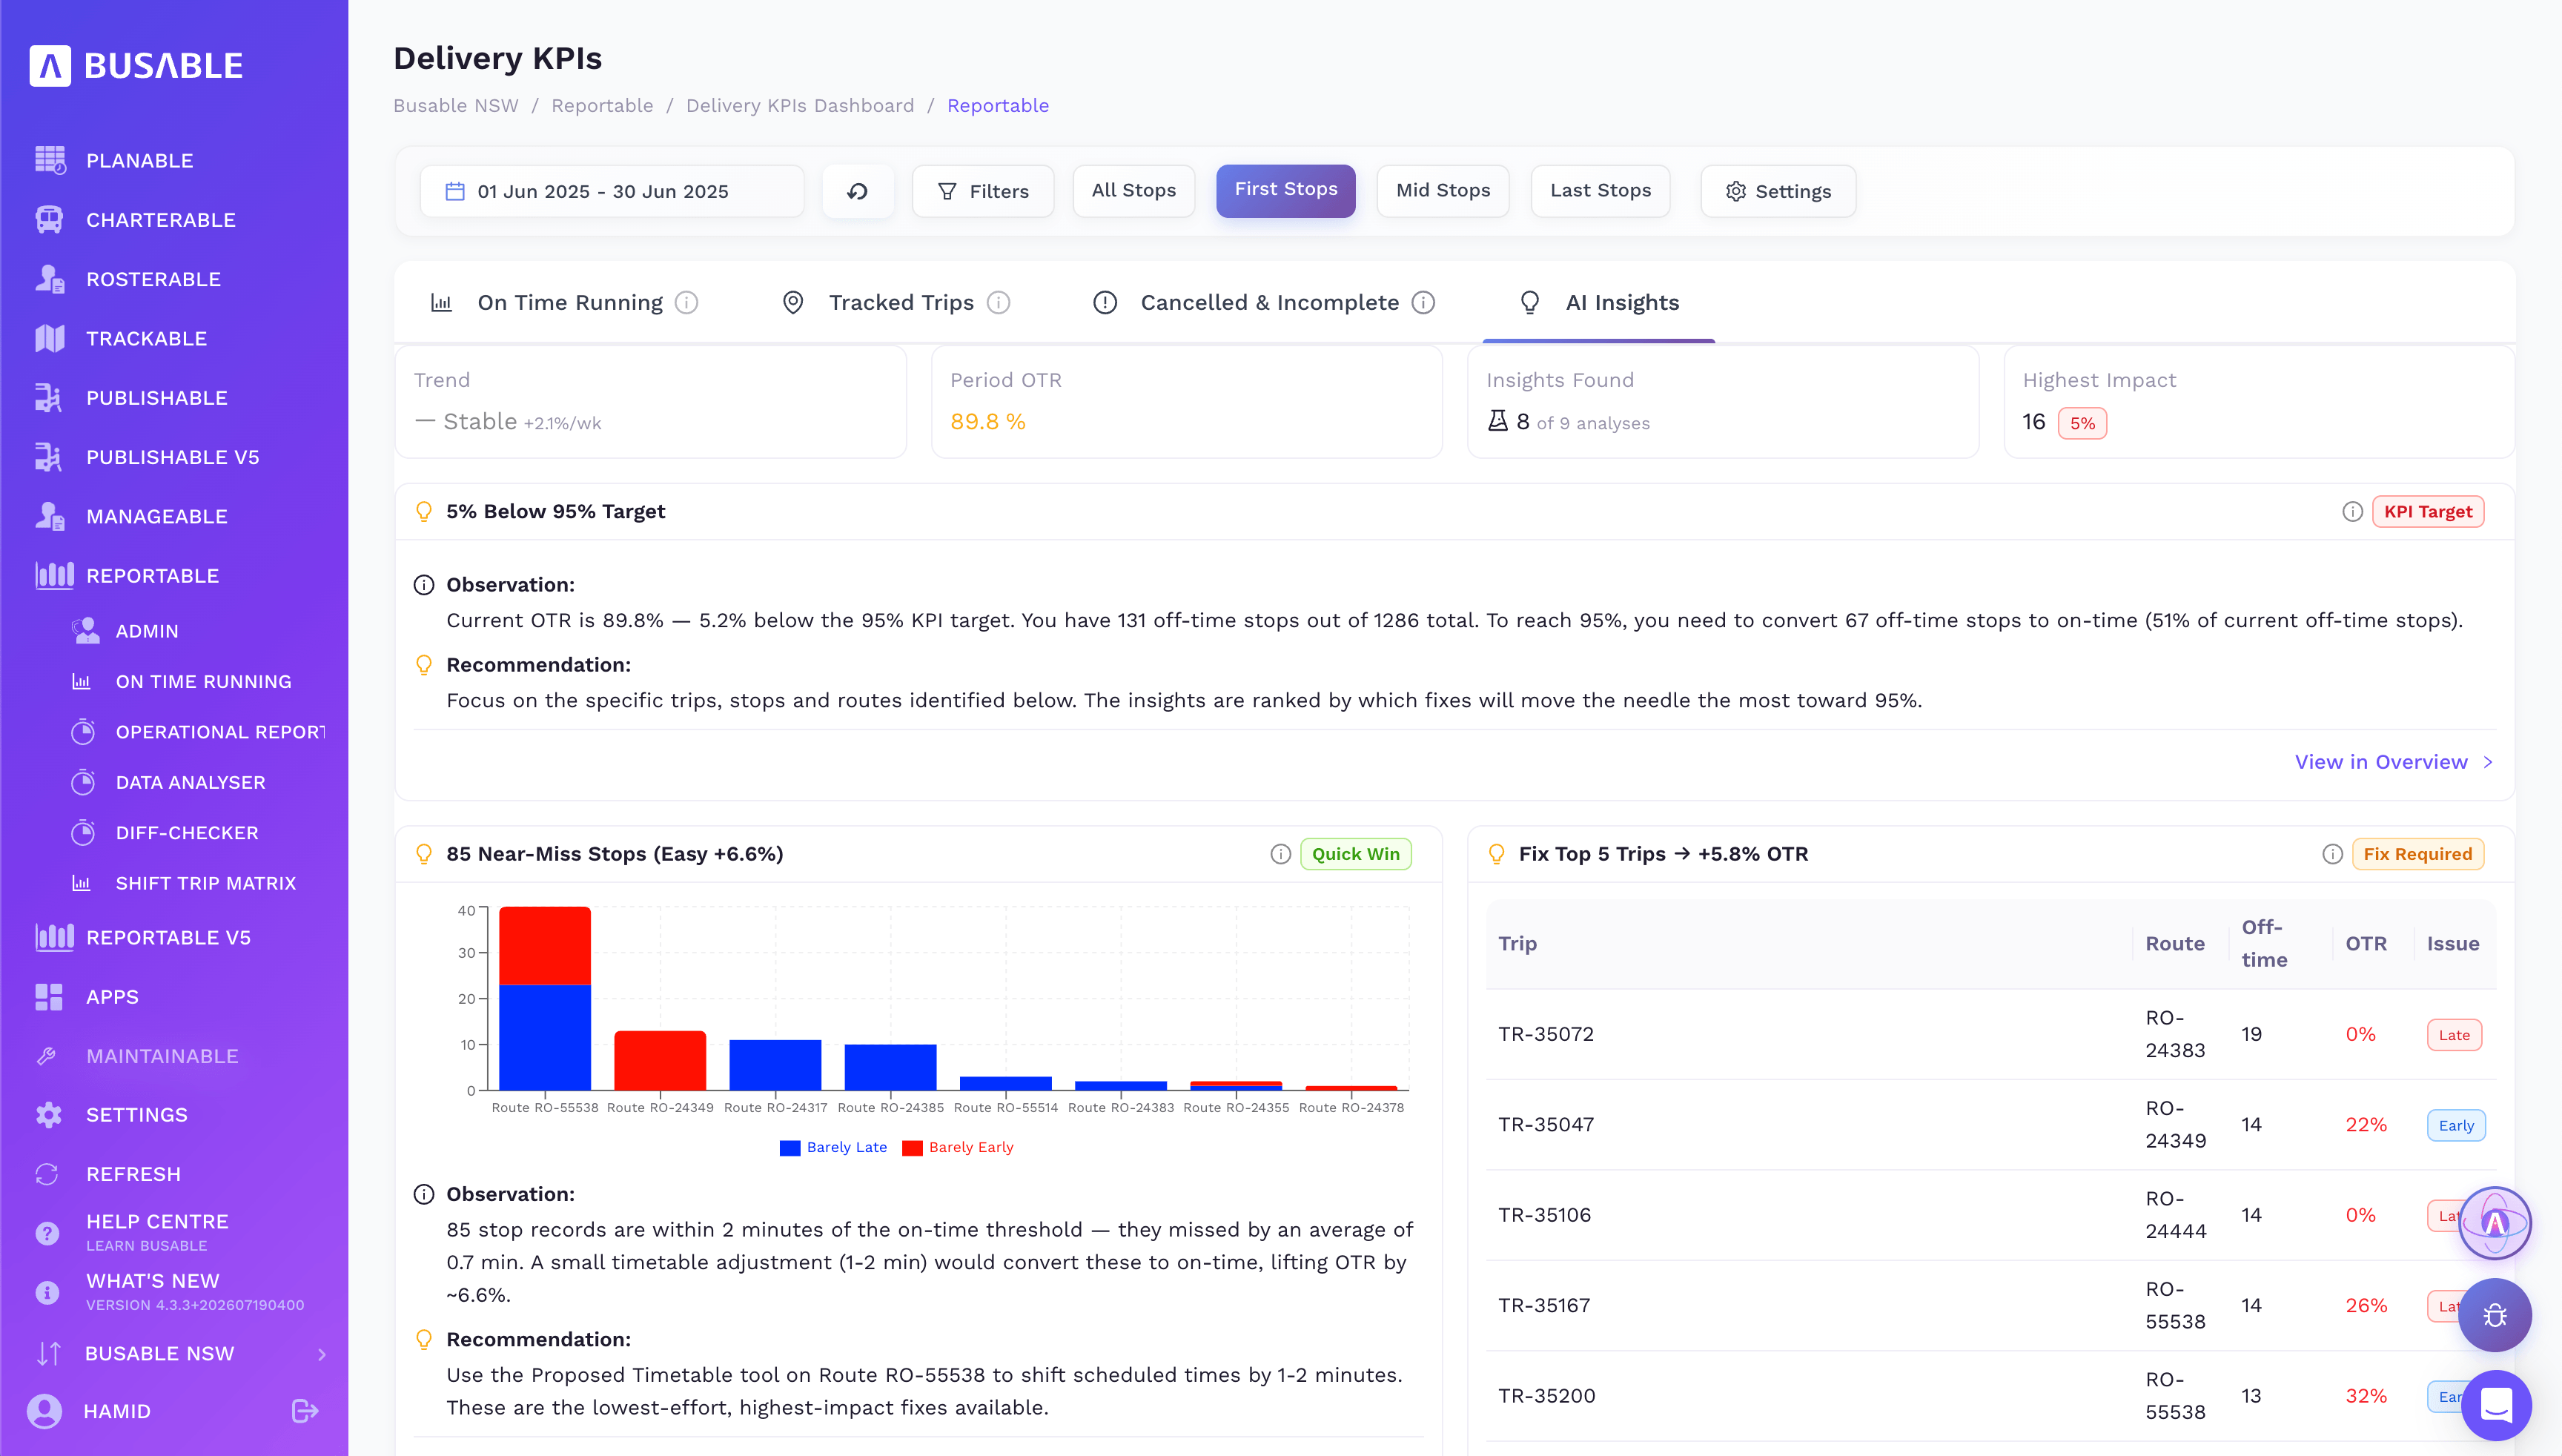
How far off target you are, the near-miss stops a small timetable shift would recover, and the top trips to fix — each with the OTR it would add.
Validate routes, schedules and stop patterns against GTFS and TfNSW (TODIS) rules — load your network or import a feed, and get every issue with a link to the fix.
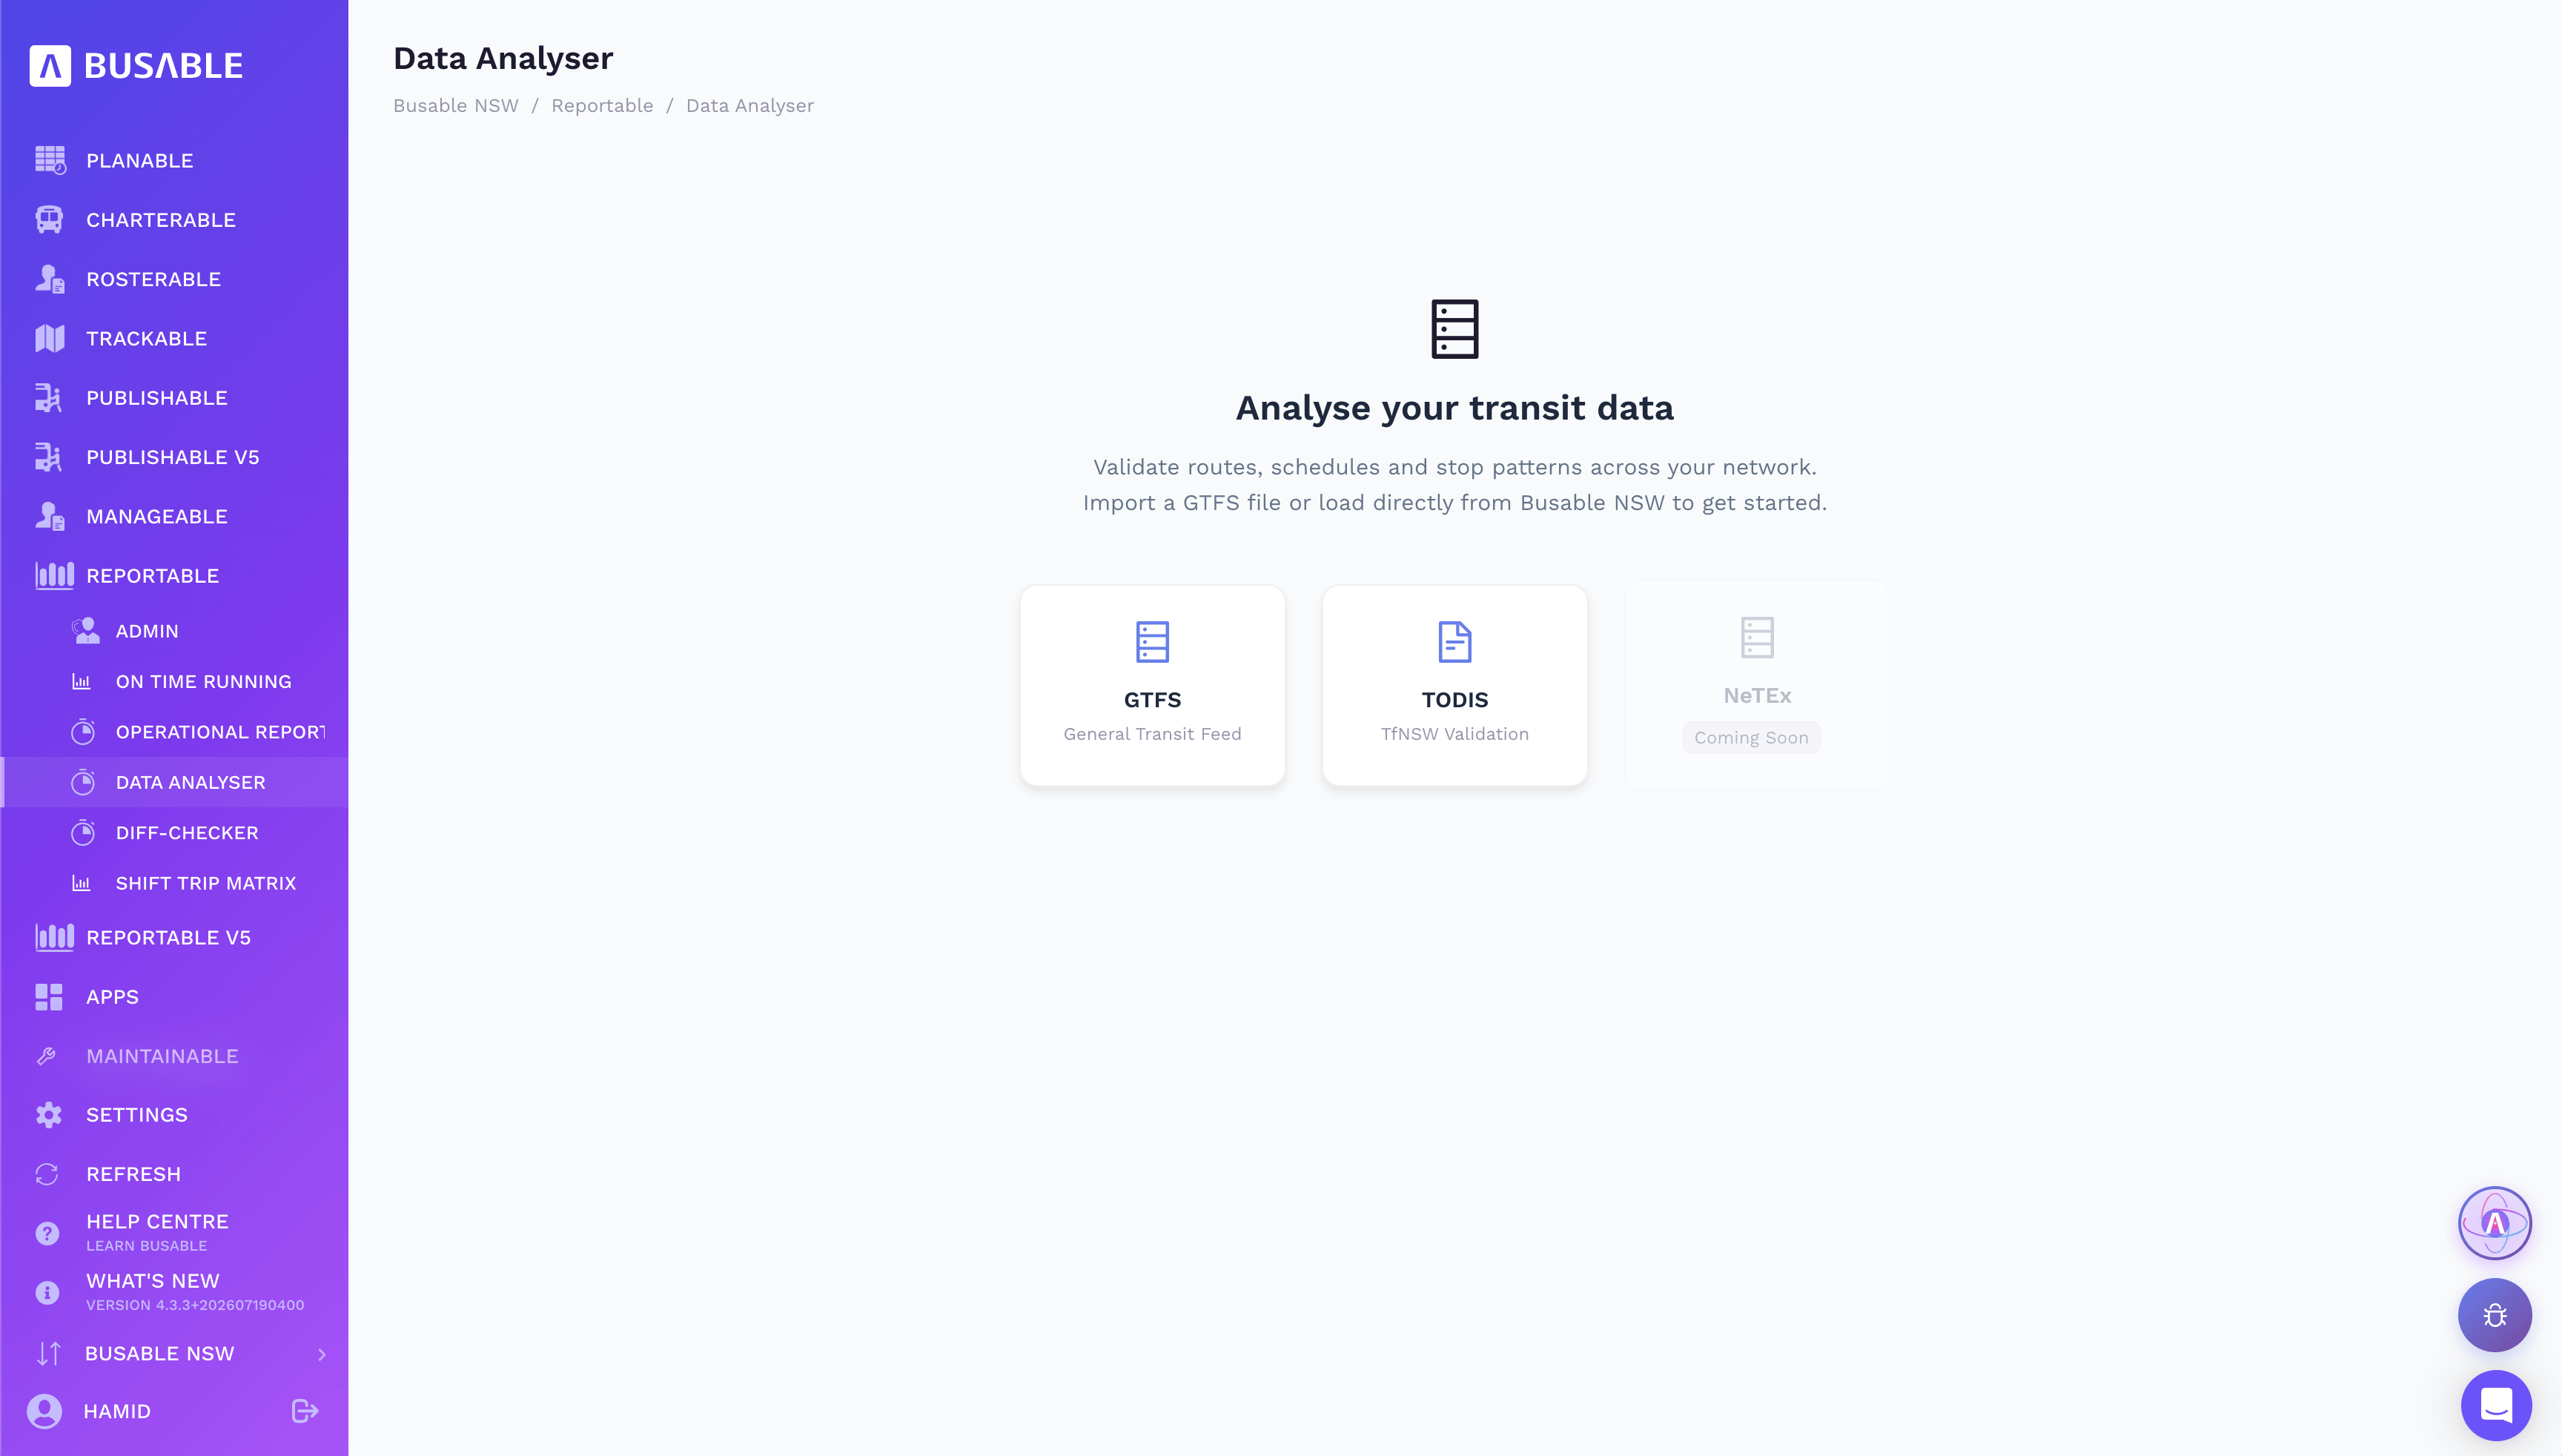
Validate against GTFS or TfNSW's TODIS rules — load your network directly or import a feed.
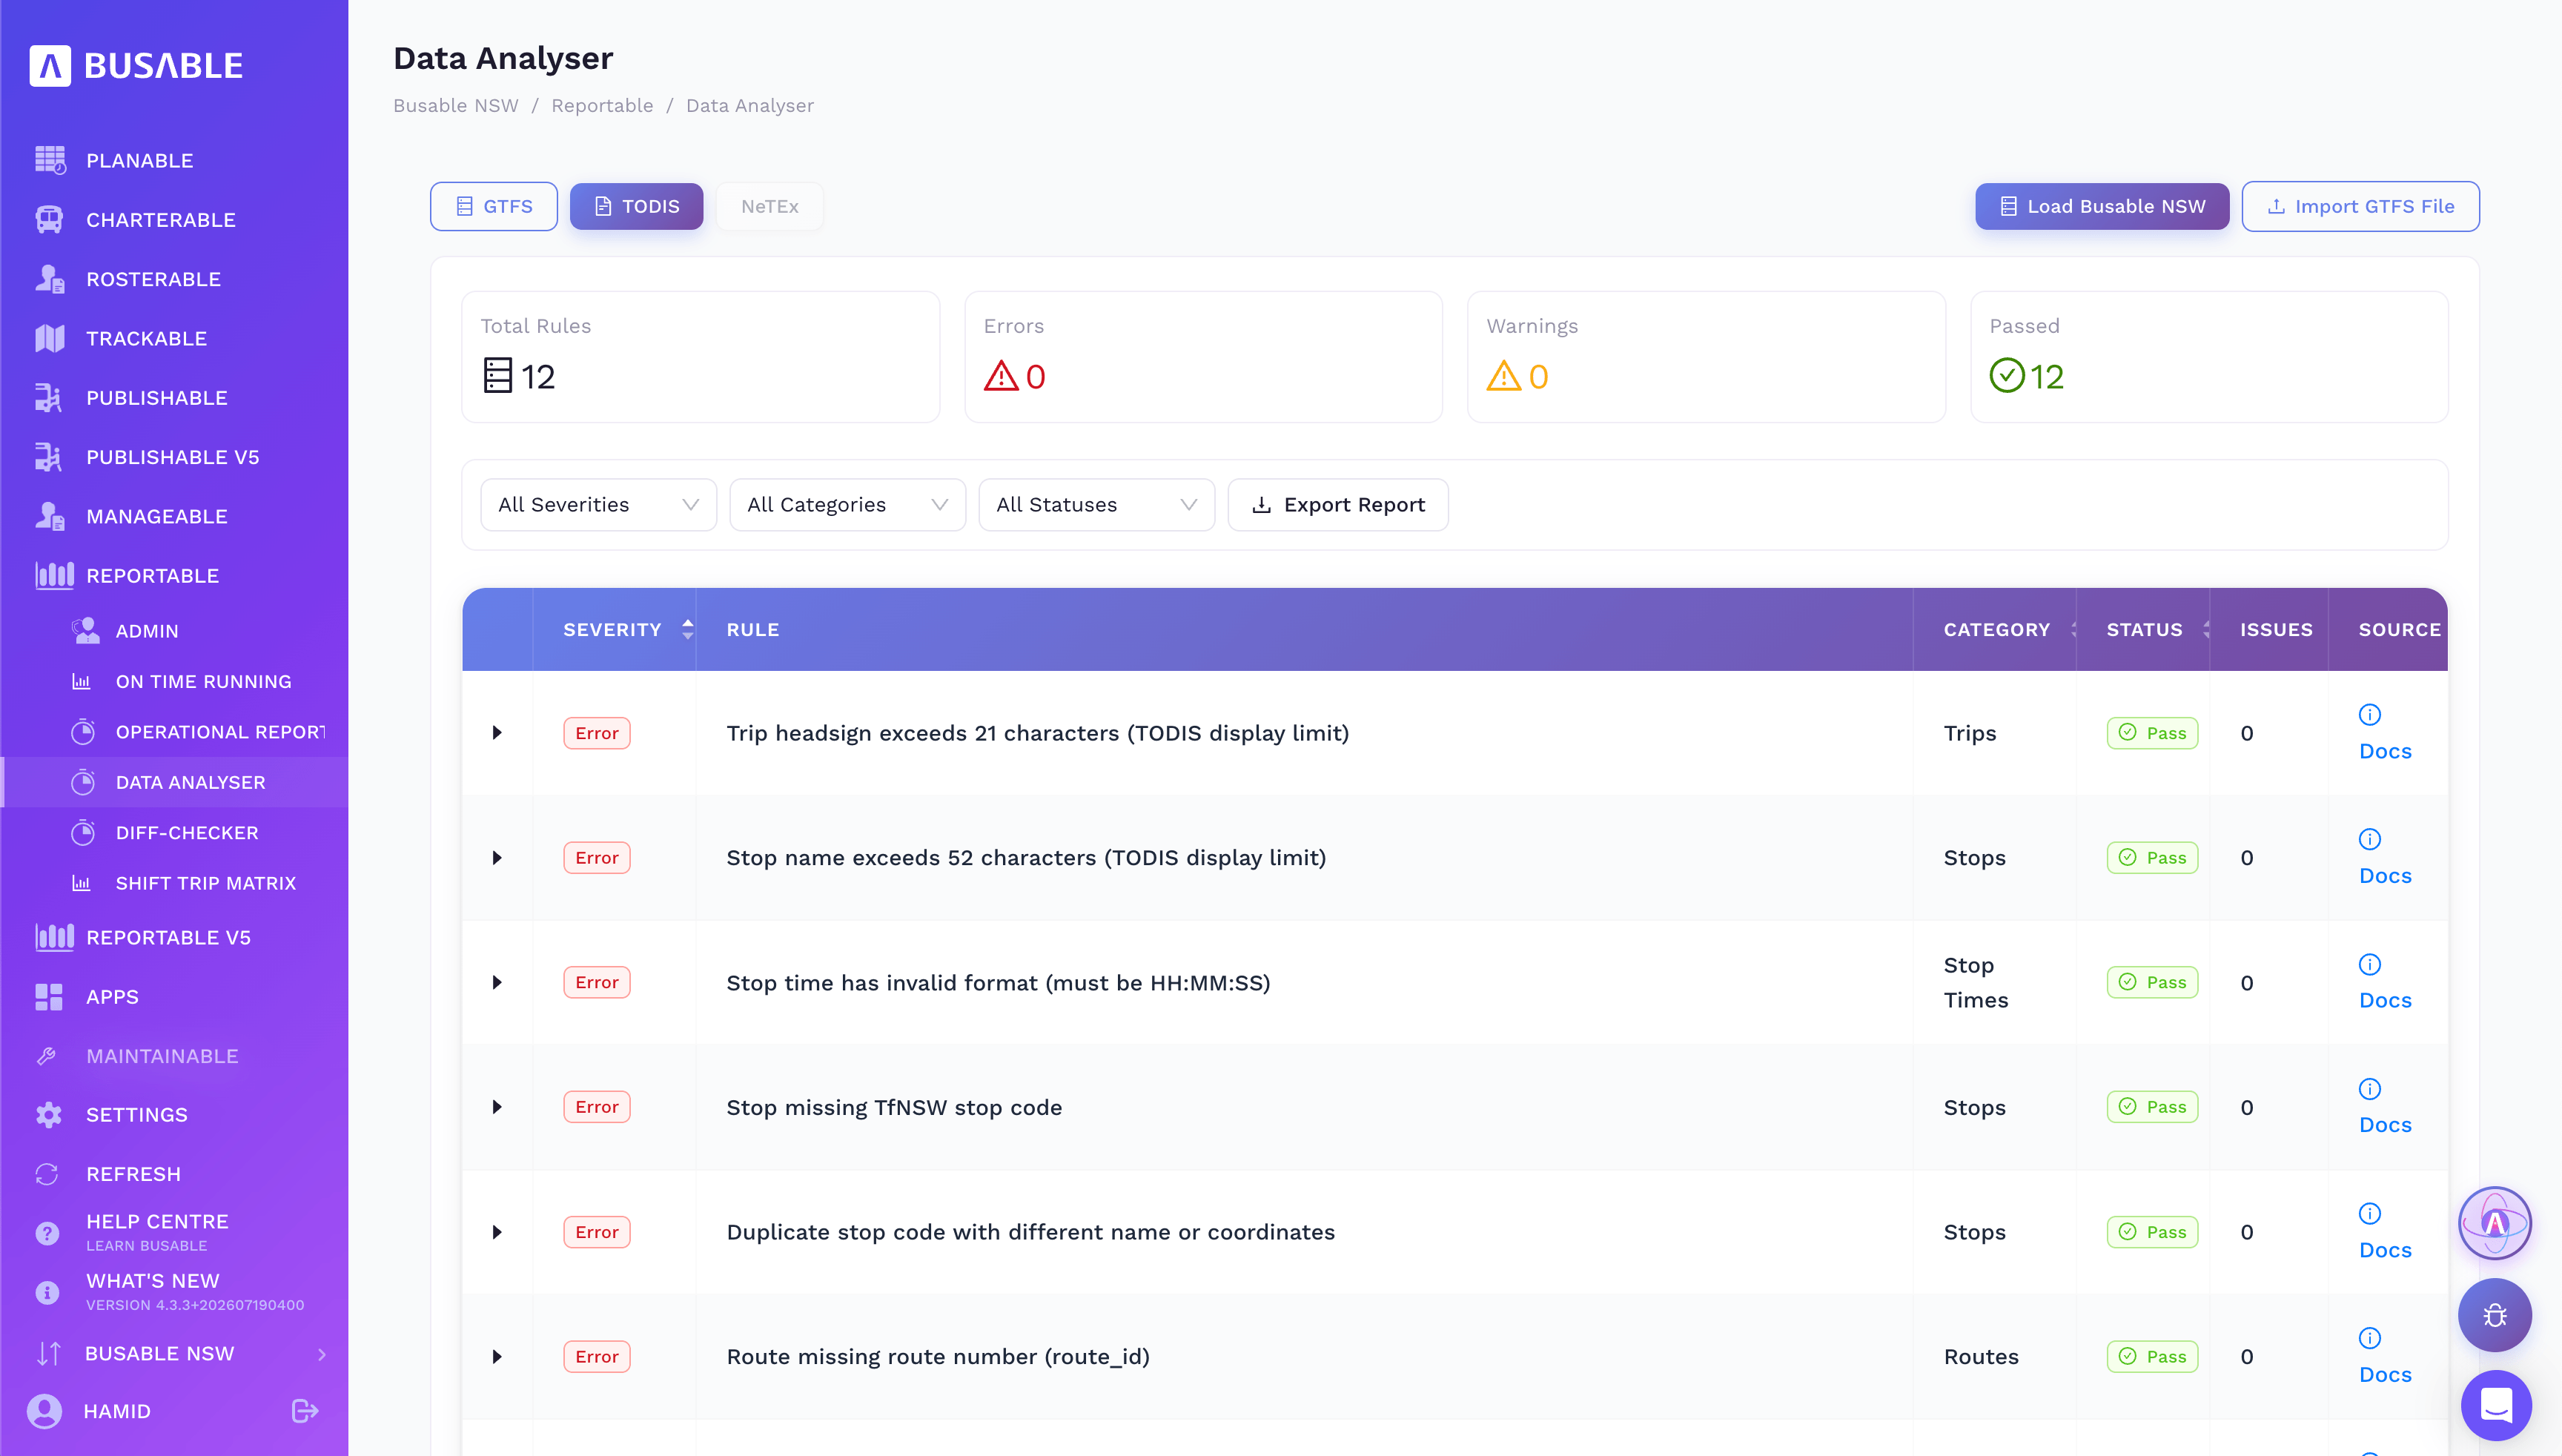
Rules passed, errors and warnings by category — headsign length, stop codes, stop times — with a report to export.
Drop in the old feed and the new one and see exactly what moved — routes, stops, trips and calendars — before you publish.
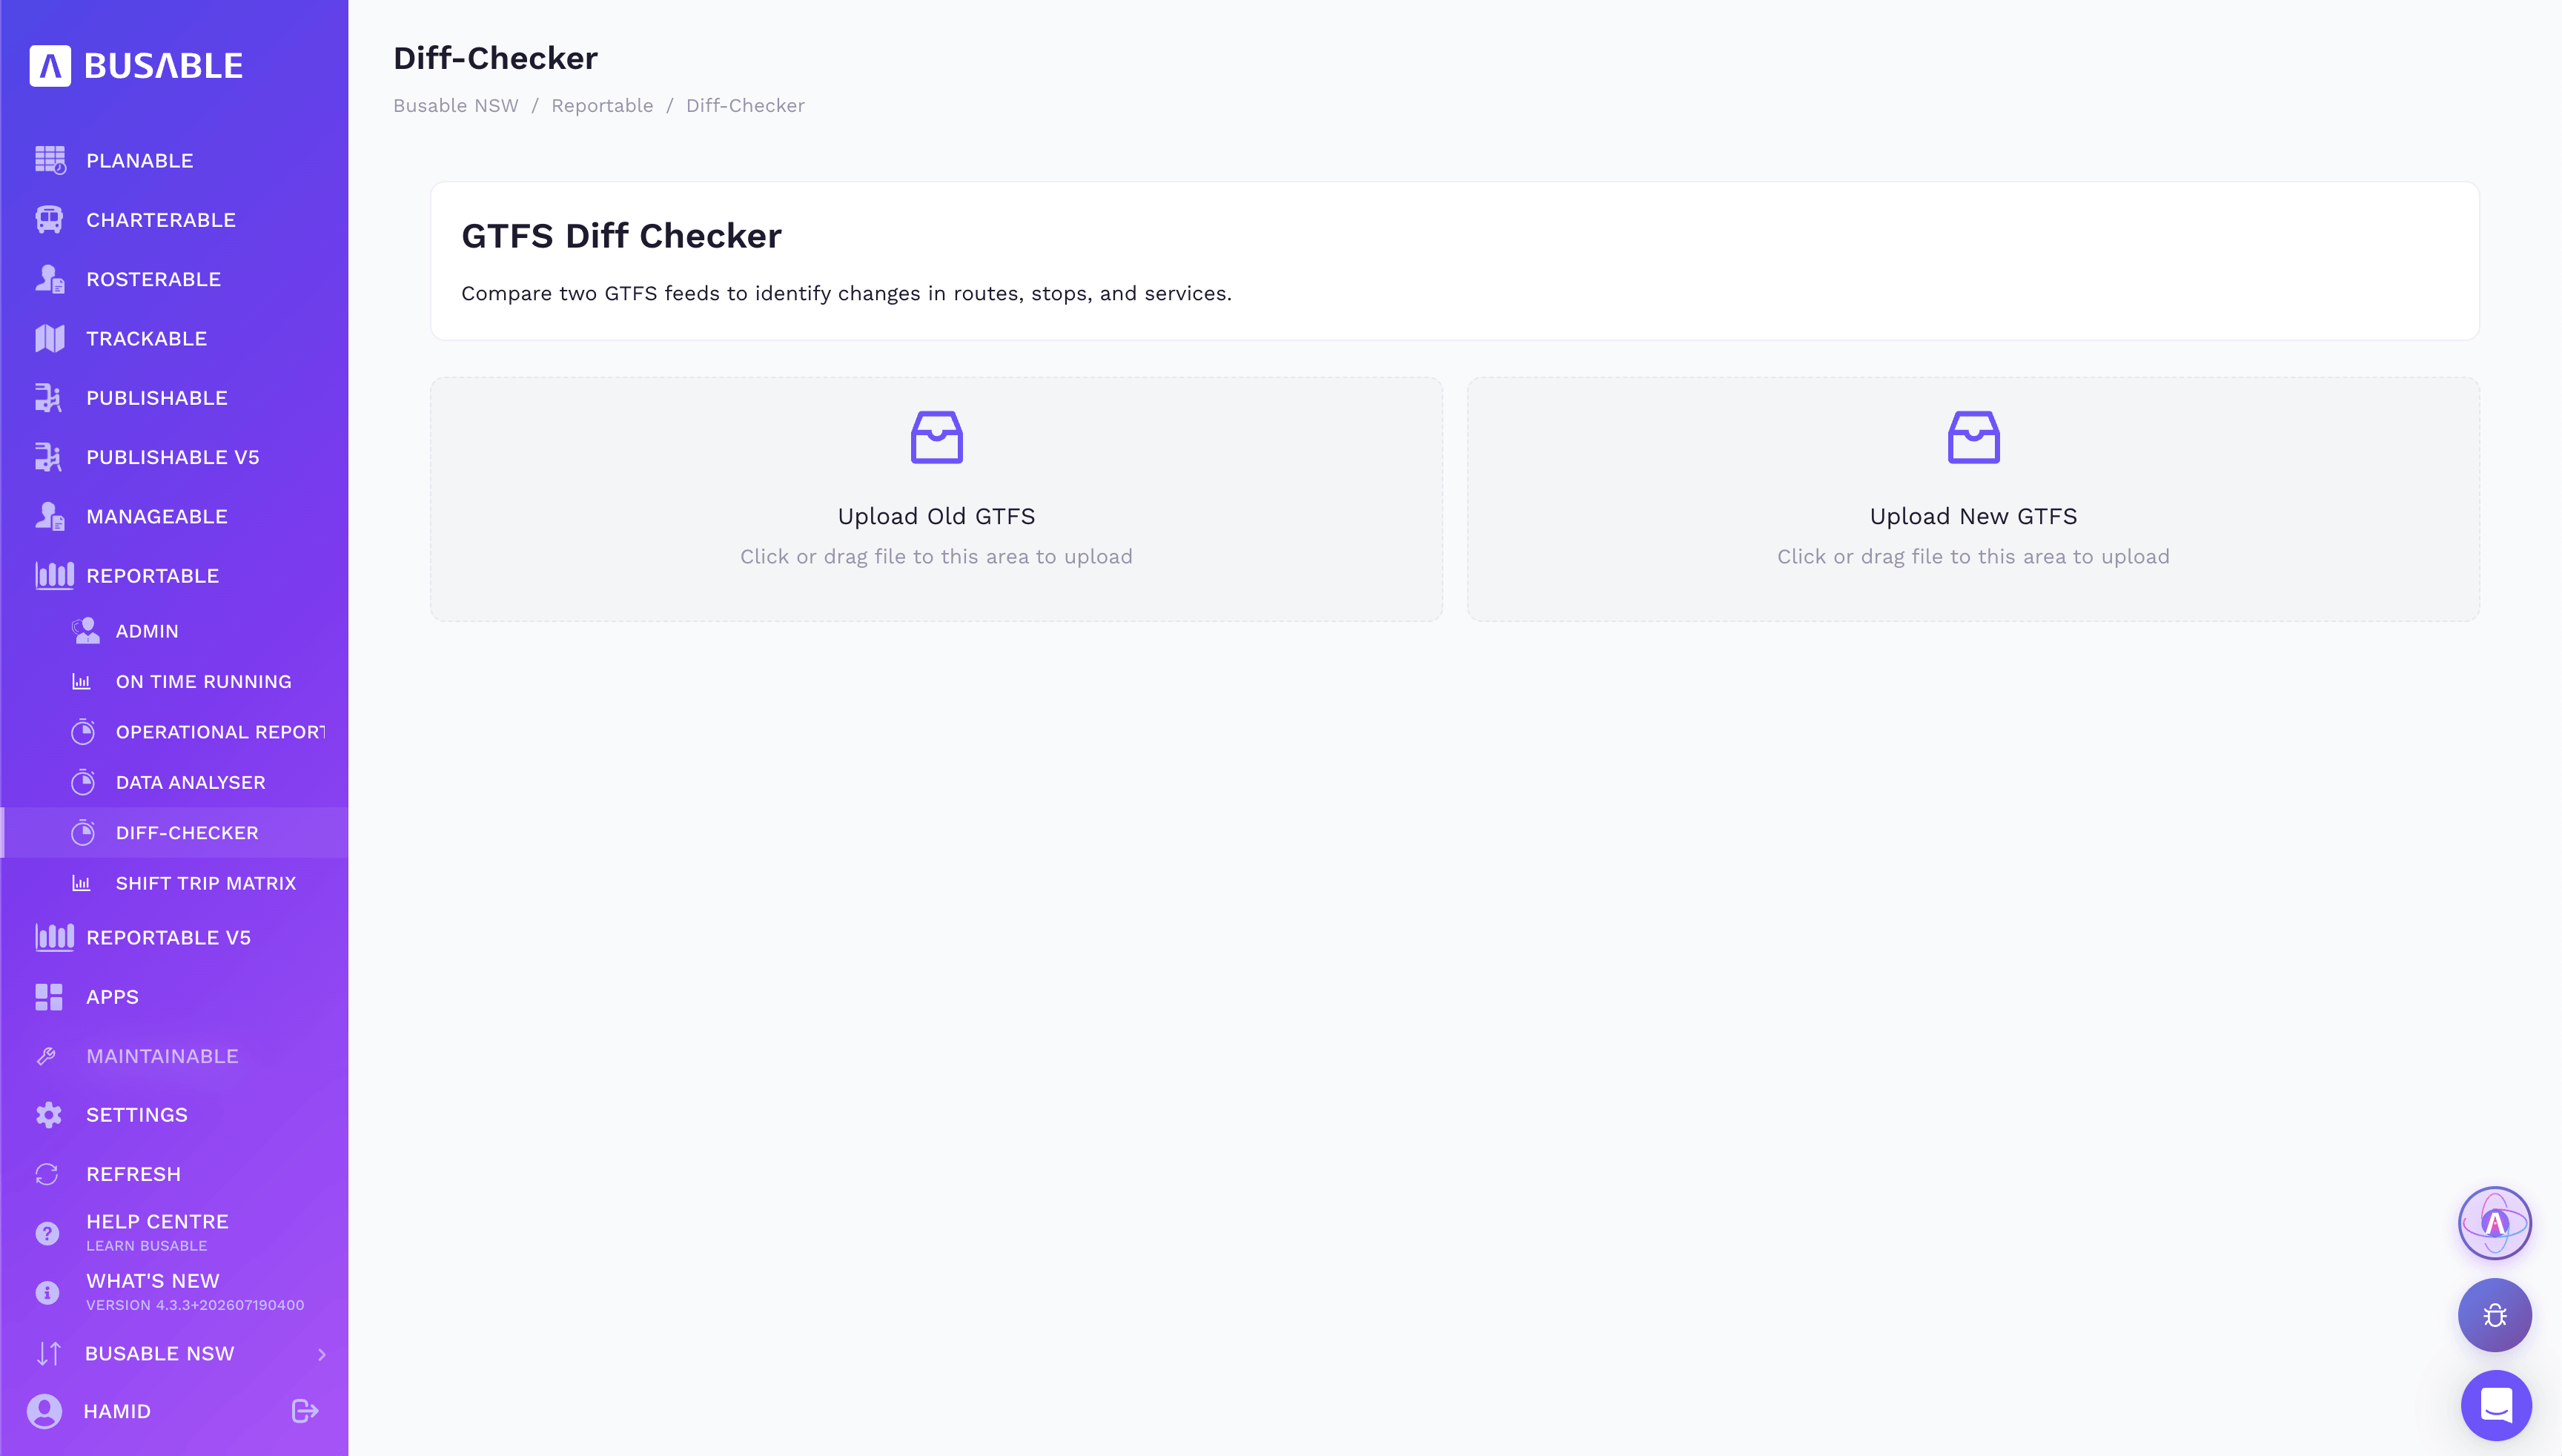
Upload the two GTFS feeds you want to compare and Reportable does the rest.
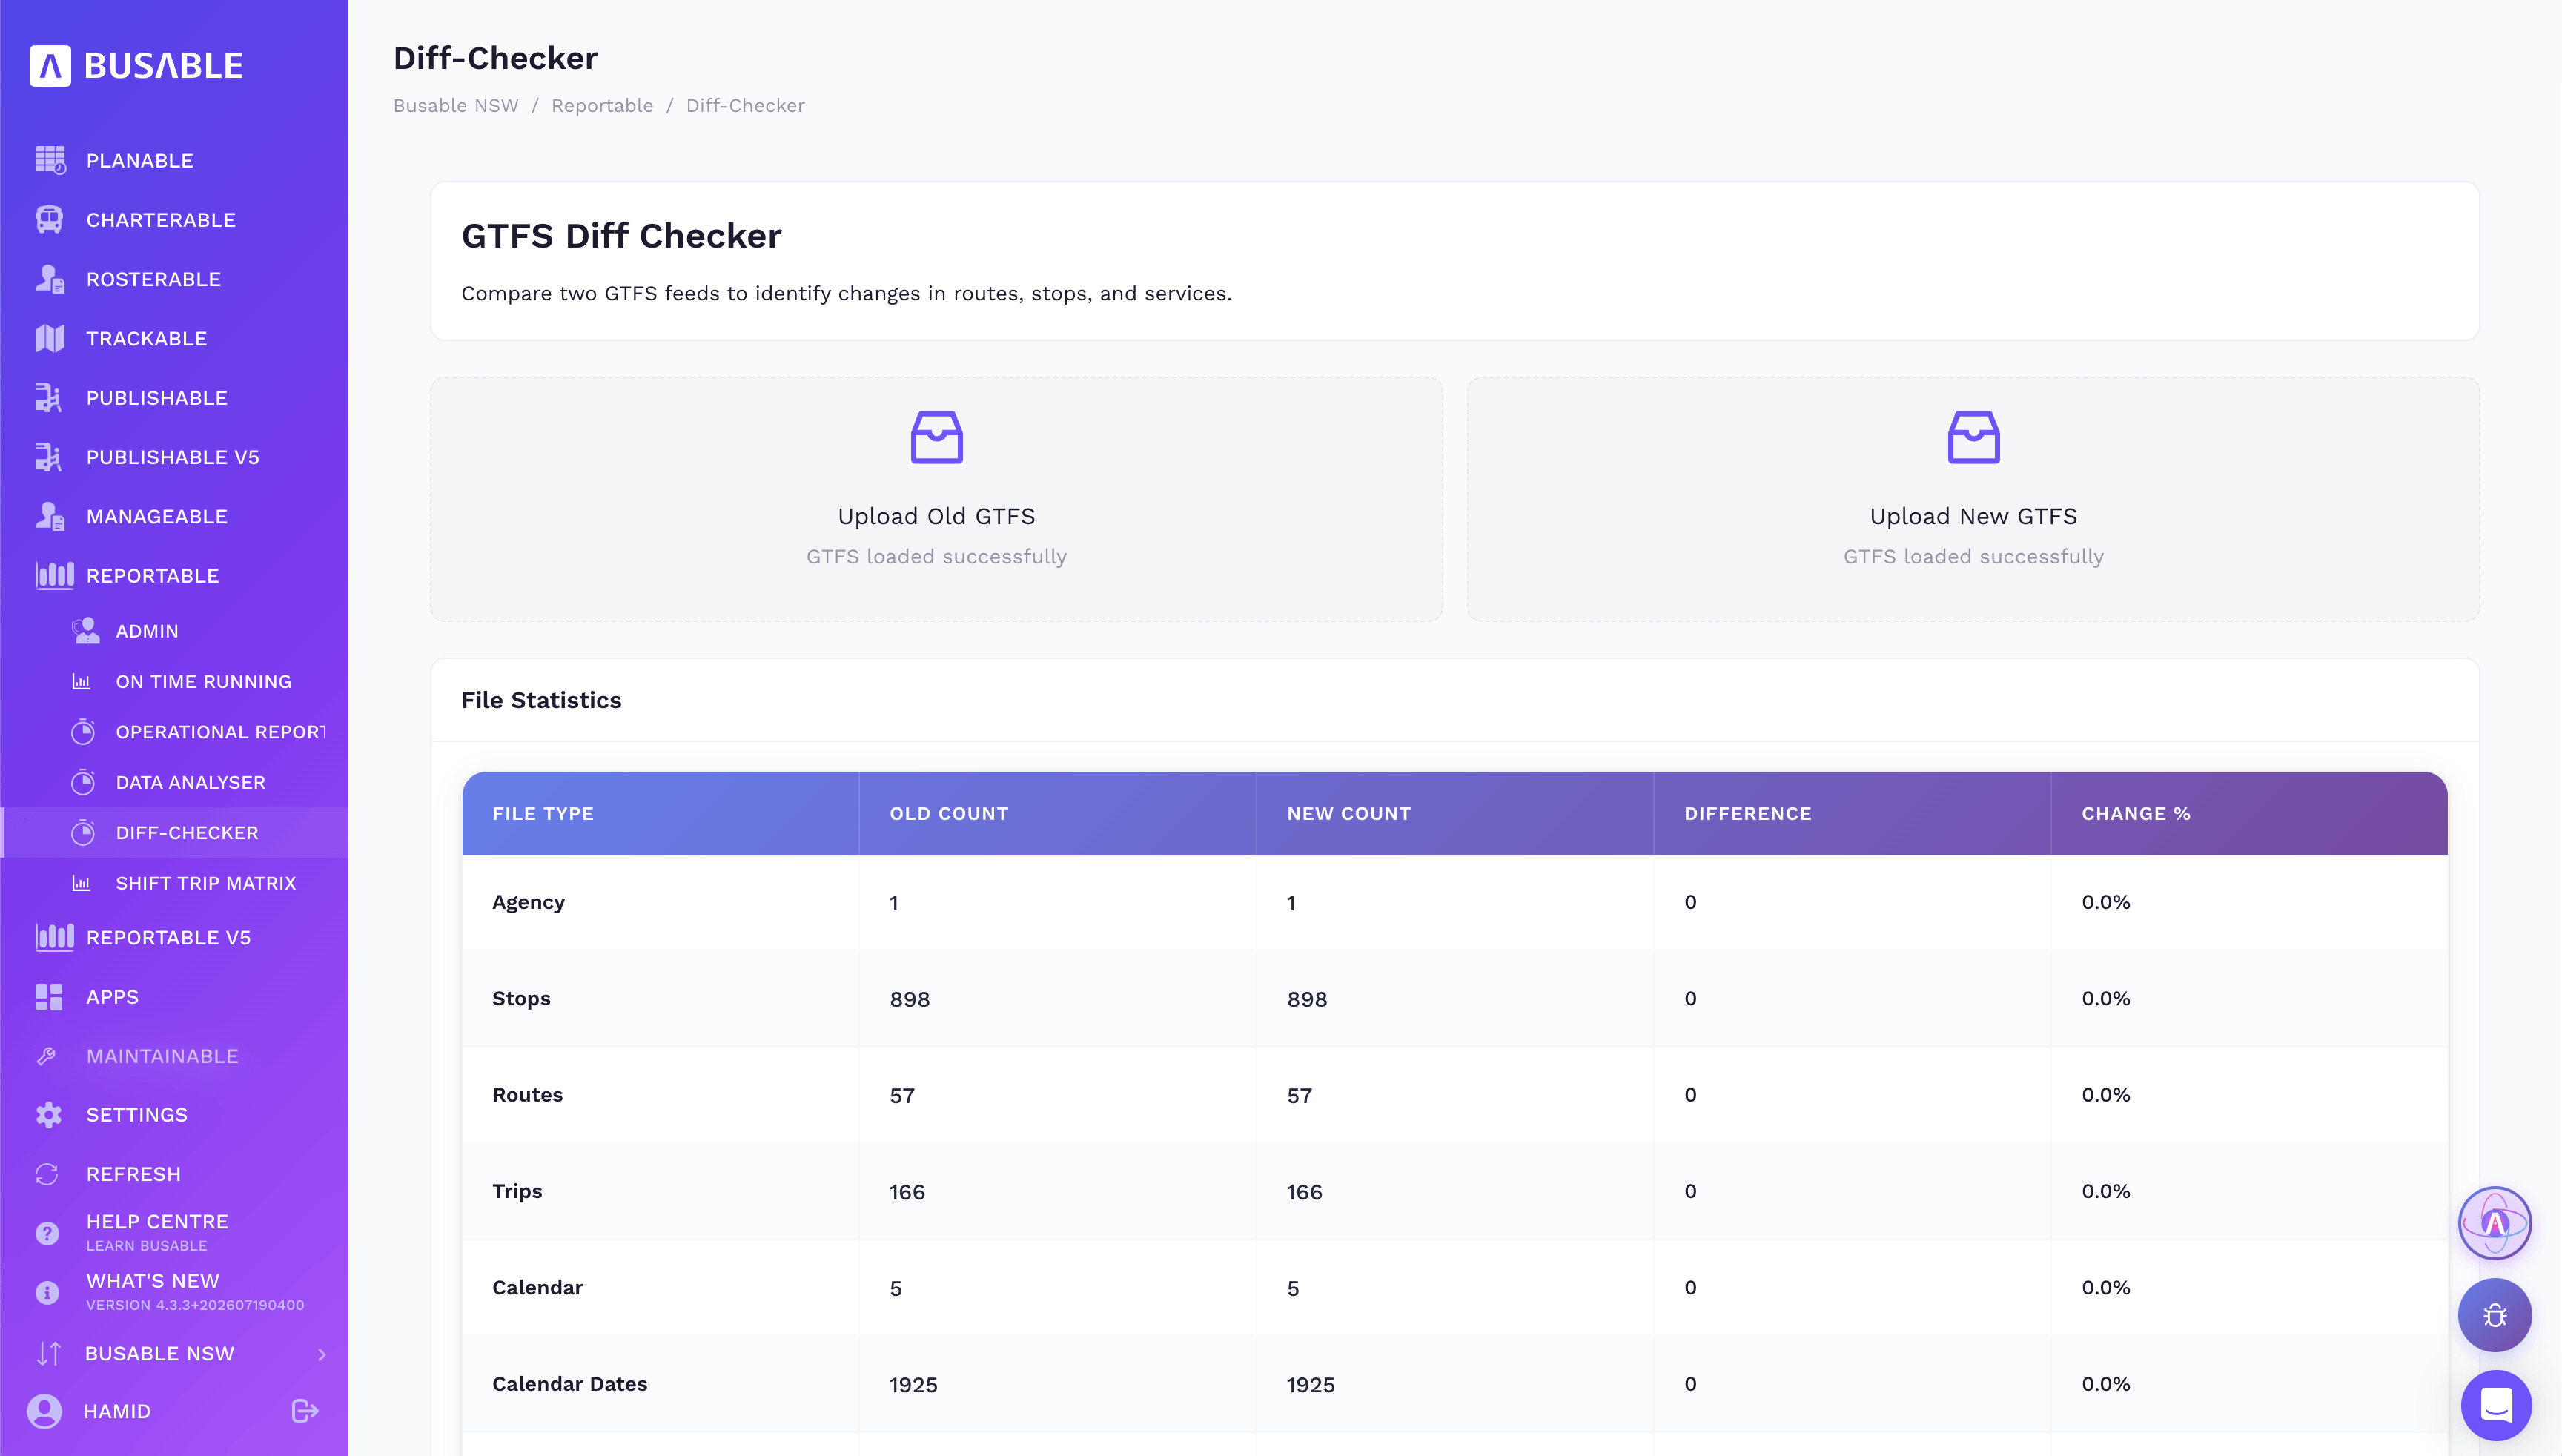
Counts for each file — agency, stops, routes, trips, calendars — with the difference and the change against the old feed.
The whole operation as one matrix — blocks, revenue trips, distance and hours — with pull-outs, dead running and regular trips broken out and filterable.
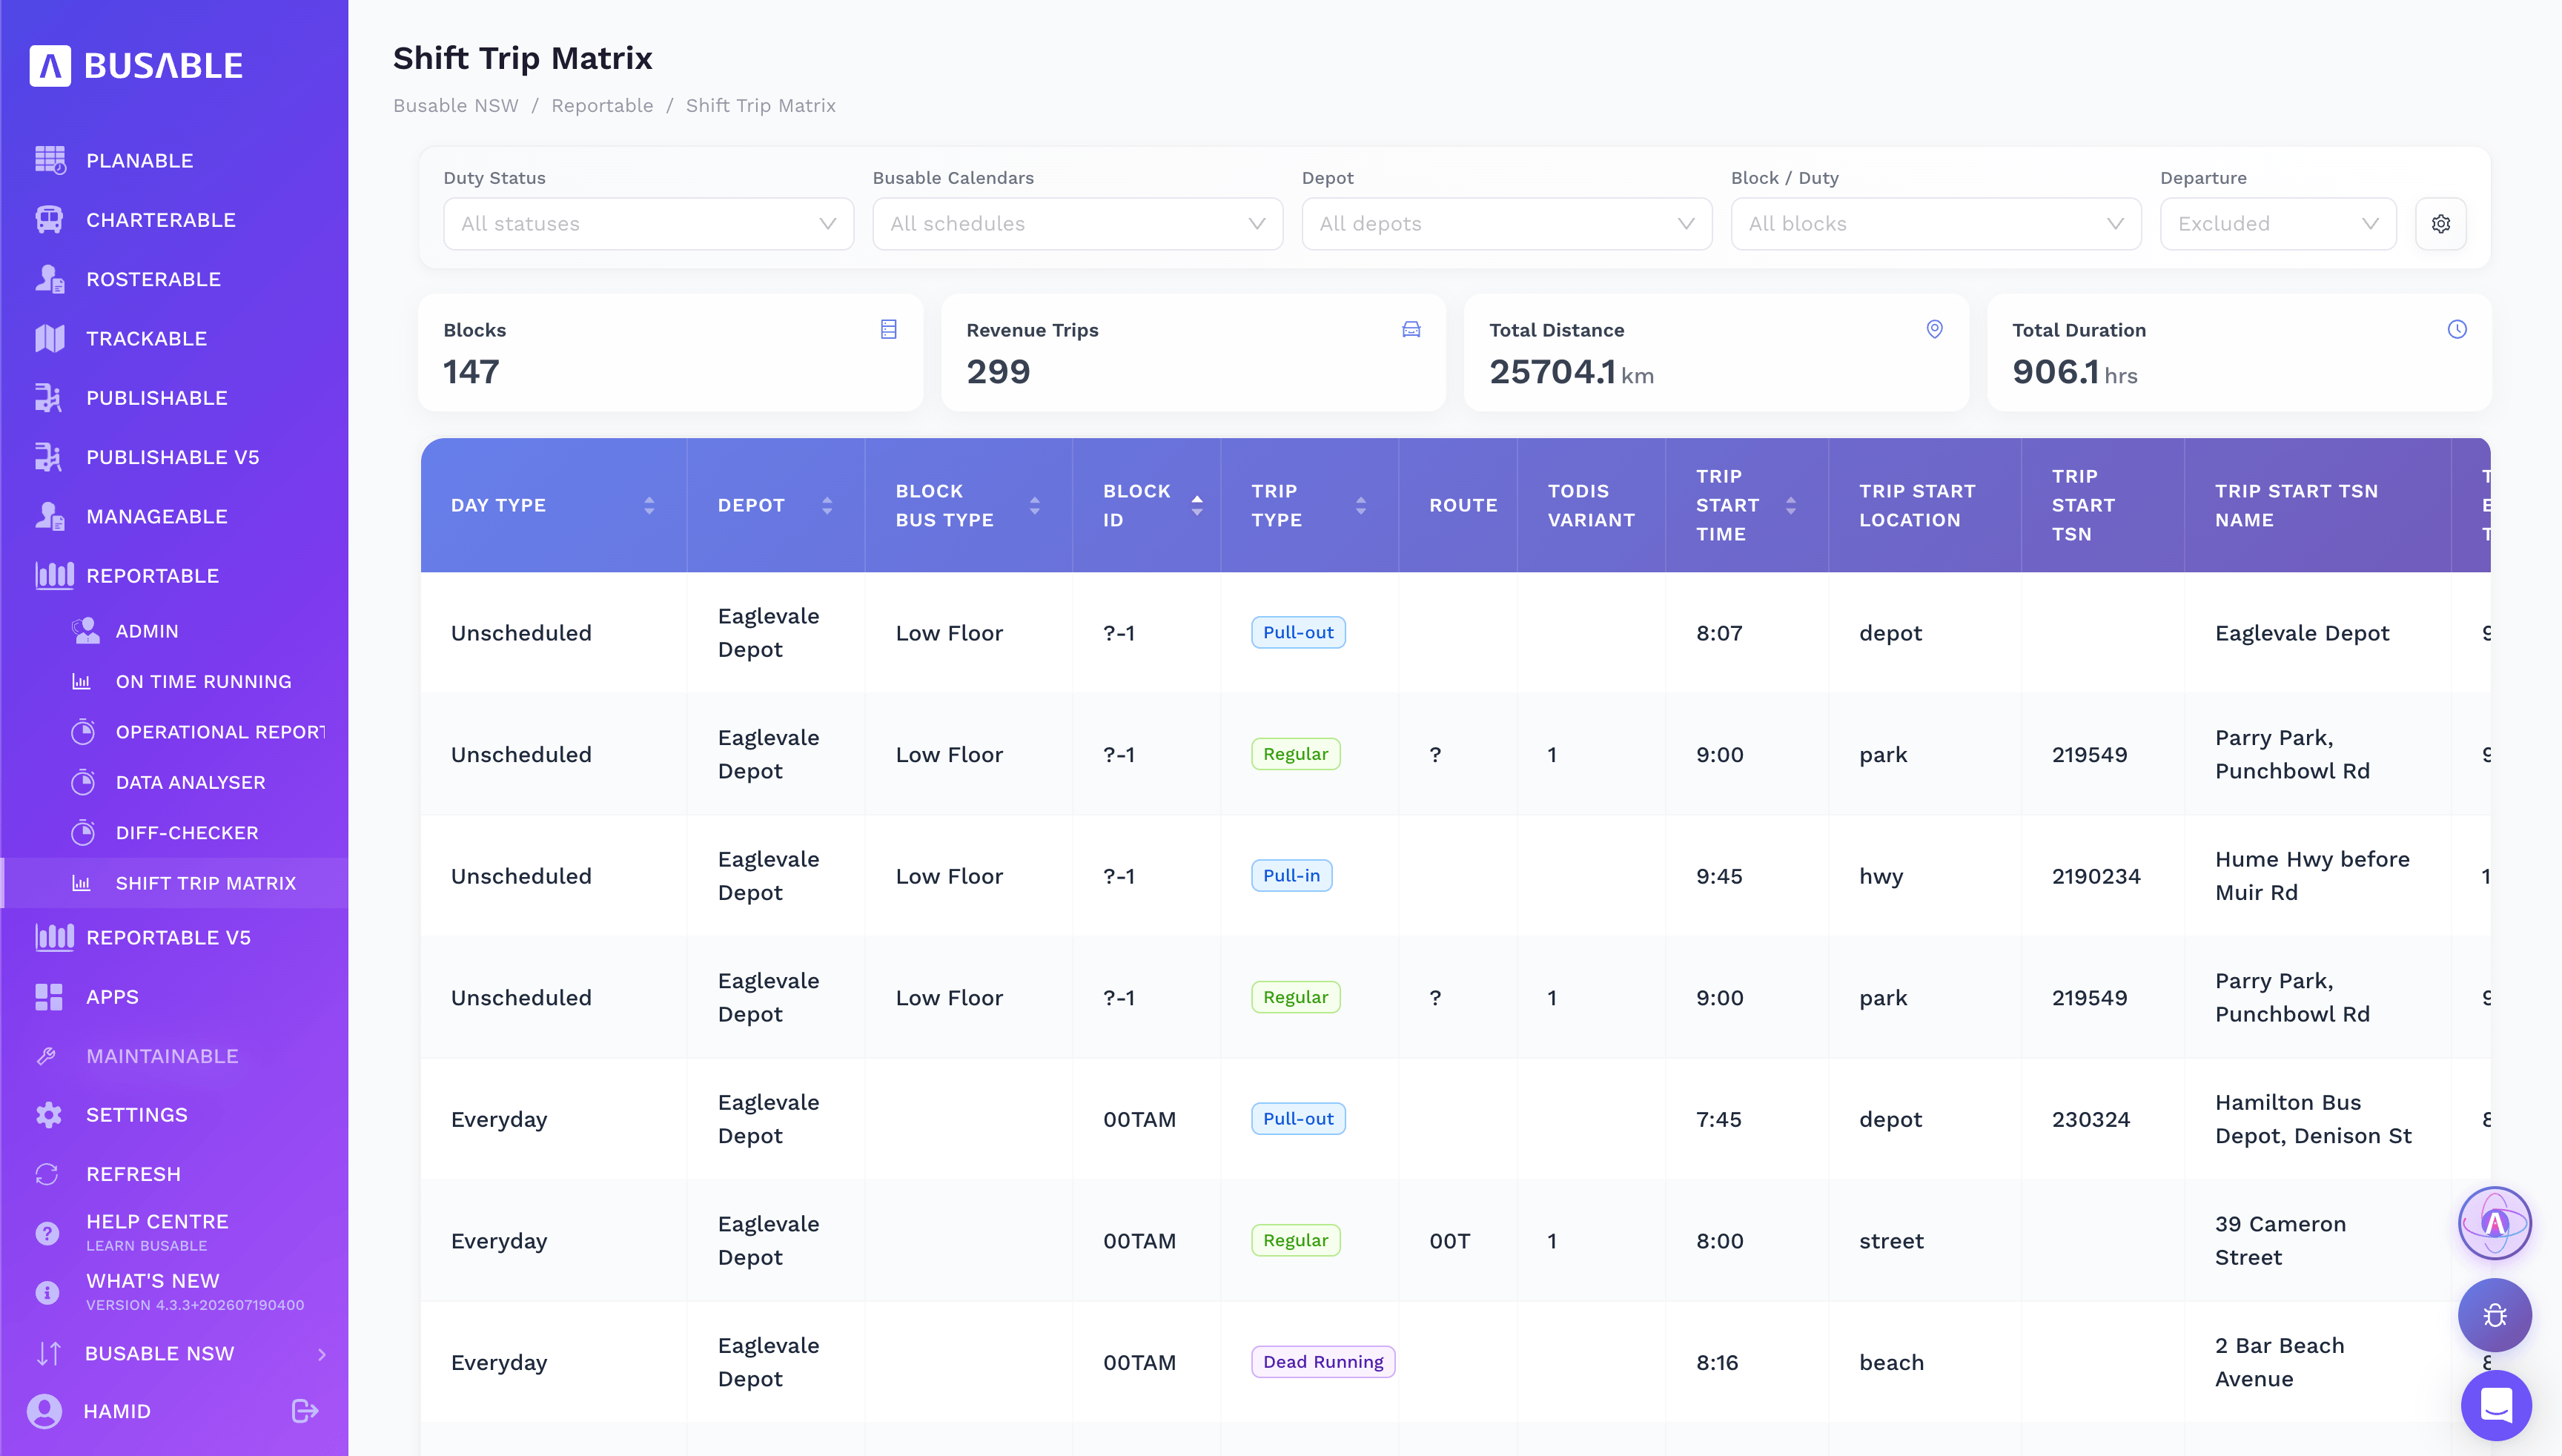
Blocks, revenue trips, total distance and hours up top, then every trip — day type, depot, block, trip type, route and start — ready to filter and export.
We'll load your network and contracts and walk you through it end to end.
Book a demo